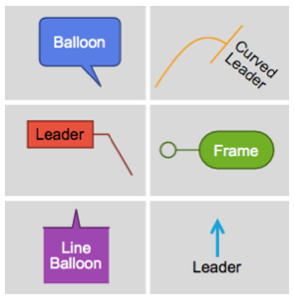
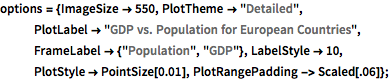
Sistema de anotação de atributos dos pontos
Colocar anotações em pontos dispersos com legendas de vários comprimentos pode ser um desafio, se feito manualmente. O novo sistema de anotação possui uma solução automática.
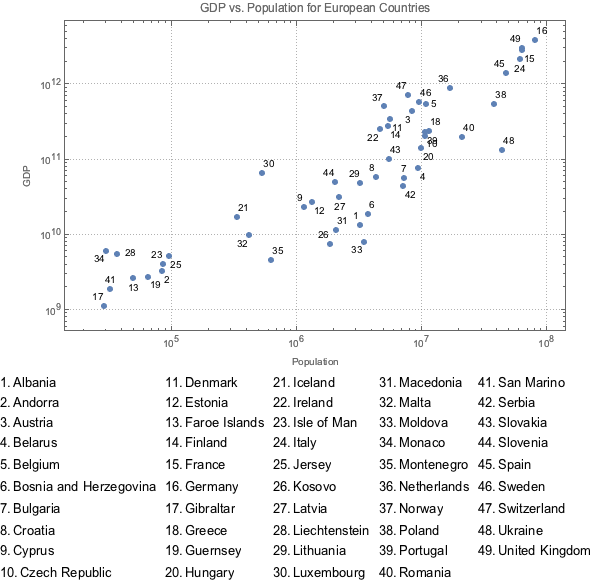
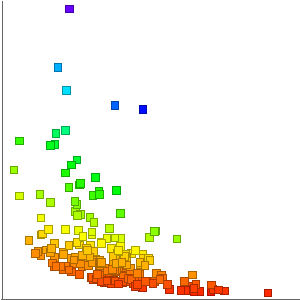
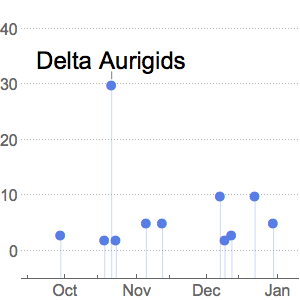
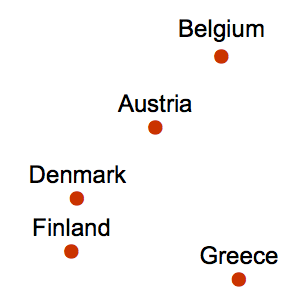
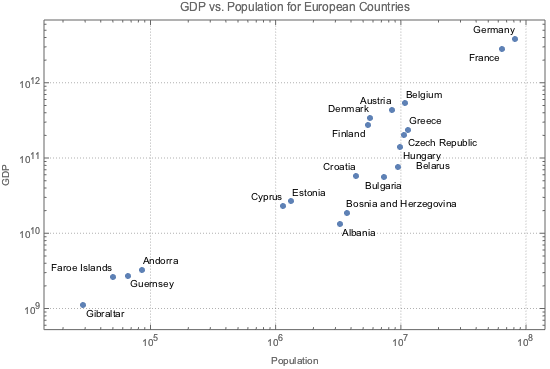
Aqui temos o exemplo de um gráfico do PIB em relação à população de todos os países europeus.
mostre o input completo da Wolfram Language
In[2]:=
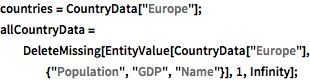
countries = CountryData["Europe"];
allCountryData =
DeleteMissing[
EntityValue[CountryData["Europe"], {"Population", "GDP", "Name"}],
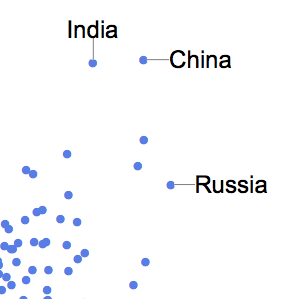
1, Infinity];Mostre 20 exemplos de anotações automáticas com atributos dos pontos.
In[3]:=
ListLogLogPlot[
 allCountryData[[1 ;; 20, {1, 2}]] ->
  allCountryData[[1 ;; 20, 3]], options]
Out[3]=
Quando os pontos forem muitos e estiverem muito concentrados, combine anotações com uma leganda, pode ser uma boa solução.
In[4]:=
legend = Multicolumn[
   Table[Text@
     Row[{ToString[i] <> ".", allCountryData[[i]][[3]]}, " "], {i,
     Length[allCountryData]}], 5];
In[5]:=
Legended[ListLogLogPlot[allCountryData[[All, {1, 2}]],
  LabelingFunction -> (First@#2 &), options], Placed[legend, Bottom]]
Out[5]=