허리케인 데이터의 시각화
소용돌이의 간단한 모델은 핵 내의 바디 회전과 핵 외의 감쇠하는 각 속도와의 조합으로 함께 주어집니다.
전체 Wolfram 언어 입력 표시하기
In[2]:=
wind[r_, z_] := If[r <= rcore, w r, (w a^2)/r];압력을 구하기 위한 공식은 반경과 고도에서 다음의 공식을 부여합니다.
In[3]:=

pressure[r_, z_] :=
  If[r < rcore,
   1/2 rho w^2 r^2 - rho g z + Subscript[rho,
    0], -((rho w^2 rcore^4)/(2 r^2)) - rho g z + rho w^2 rcore^2 +
    Subscript[rho, 0]];
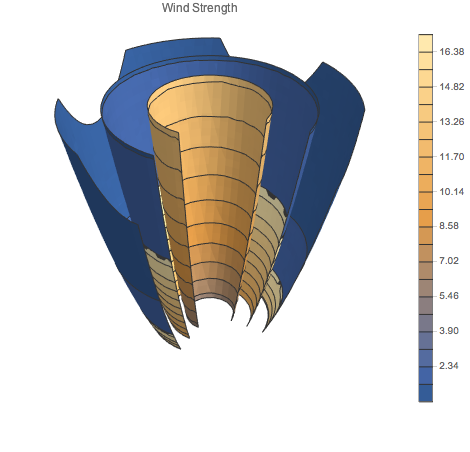
시스템의 중심의 외부가 가장 빠른 풍속을 플롯합니다.
In[4]:=

SliceContourPlot3D[
 wind[Sqrt[x^2 + y^2], z], {x^2 + y^2 == 3 z, x^2 + y^2 == 6 z,
  x^2 + y^2 == 1 z}, {x, -5, 5}, {y, -5, 5}, {z, 1, 5},
 Contours -> 20,
 RegionFunction -> Function[{x, y, z}, x < 0 || y > 0],
 PlotTheme -> "NoAxes", PlotLegends -> Automatic,
 PlotLabel -> "Wind Strength", ImageSize -> 400]
Out[4]=

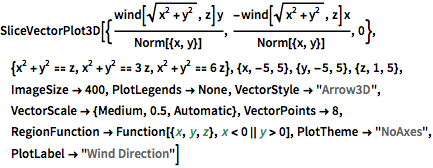
풍향을 벡터 공간으로 플롯합니다.
In[5]:=

SliceVectorPlot3D[{(wind[Sqrt[x^2 + y^2], z] y)/
  Norm[{x, y}], (-wind[Sqrt[x^2 + y^2], z] x)/Norm[{x, y}],
  0}, {x^2 + y^2 == z, x^2 + y^2 == 3 z, x^2 + y^2 == 6 z}, {x, -5,
  5}, {y, -5, 5}, {z, 1, 5}, ImageSize -> 400, PlotLegends -> None,
 VectorStyle -> "Arrow3D", VectorScale -> {Medium, 0.5, Automatic},
 VectorPoints -> 8,
 RegionFunction -> Function[{x, y, z}, x < 0 || y > 0],
 PlotTheme -> "NoAxes", PlotLabel -> "Wind Direction"]
Out[5]=

압력을 3D 밀도로 플롯합니다. 시스템의 중심이 낮은 상대 밀도에 유의합니다.
In[6]:=

DensityPlot3D[
 pressure[Sqrt[x^2 + y^2], z], {x, -5, 5}, {y, -5, 5}, {z, 1, 5},
 ImageSize -> 400, PlotLegends -> Automatic, PlotTheme -> "NoAxes",
 RegionFunction ->
  Function[{x, y, z}, (x^2 + y^2 <= 6 z) && (x < 0 || y > 0)],
 PlotLabel -> "Air Pressure",
 OpacityFunction -> Function[f, f/5 + 0.1]]
Out[6]=


