"슈퍼 푸드"의 분석, 시각화, 및 비교
슈퍼 푸드는 한가지 이상의 영양소의 함량이 매우 높은 음식을 말합니다다. 이 예에서는 슈퍼 푸드의 집합을 정의하고 Wolfram Knowledgebase의 음식 데이터를 사용하여 보다 일반적인 식품과 비교합니다. 마지막으로, "슈퍼"라는 형용 어구를 가진 음식의 가치에 어울리는 휘장을 구성합니다.
먼저, 슈퍼 푸드와 그것이 포함하고 있다고 알려져있는 유명한 영양소의 목록을 정의합니다
In[1]:=
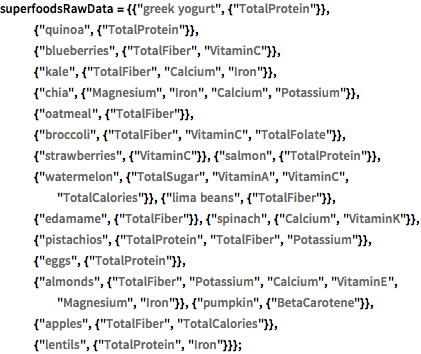
superfoodsRawData = {{"greek yogurt", {"TotalProtein"}}, {"quinoa", \
{"TotalProtein"}}, {"blueberries", {"TotalFiber",
"VitaminC"}}, {"kale", {"TotalFiber", "Calcium",
"Iron"}}, {"chia", {"Magnesium", "Iron", "Calcium",
"Potassium"}}, {"oatmeal", {"TotalFiber"}}, {"broccoli", \
{"TotalFiber", "VitaminC",
"TotalFolate"}}, {"strawberries", {"VitaminC"}}, {"salmon", \
{"TotalProtein"}}, {"watermelon", {"TotalSugar", "VitaminA",
"VitaminC", "TotalCalories"}}, {"lima beans", {"TotalFiber"}},
{"edamame", {"TotalFiber"}}, {"spinach", {"Calcium",
"VitaminK"}}, {"pistachios", {"TotalProtein", "TotalFiber",
"Potassium"}}, {"eggs", {"TotalProtein"}}, {"almonds", \
{"TotalFiber", "Potassium", "Calcium", "VitaminE", "Magnesium",
"Iron"}}, {"pumpkin", {"BetaCarotene"}}, {"apples", \
{"TotalFiber", "TotalCalories"}}, {"lentils", {"TotalProtein",
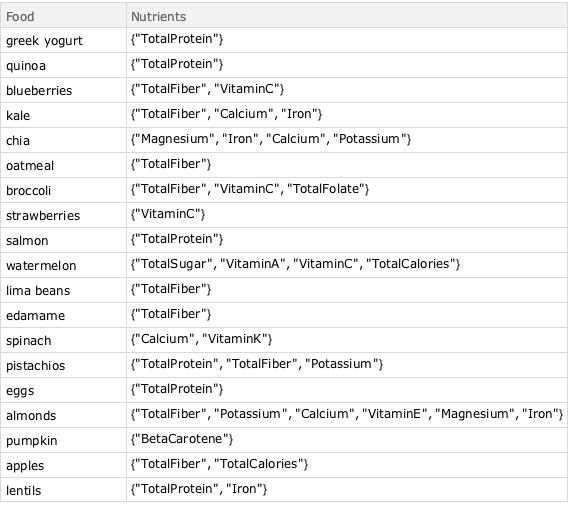
"Iron"}}};계산에 편리하도록 Dataset으로 변환합니다.
In[2]:=
superfoodsDatset =
 Dataset[<|"Food" -> #1, "Nutrients" -> #2|> & @@@ superfoodsRawData]
Out[2]=
Interpreter를 사용하여 이 슈퍼 푸드에 대응하는 Wolfram 언어의 엔티티를 얻습니다.
In[3]:=
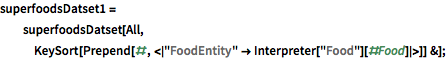
superfoodsDatset1 =
  superfoodsDatset[All,
   KeySort[Prepend[#, <|
       "FoodEntity" -> Interpreter["Food"][#Food]|>]] &];
영양소 목록을 작성합니다.
In[4]:=
Union @@ Normal[superfoodsDatset1[[All, "Nutrients"]]]Out[4]=
지정된 영양소를 적절한 특성으로 변환하는 규칙을 작성합니다.
In[5]:=
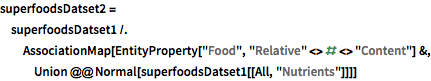
superfoodsDatset2 =
 superfoodsDatset1 /.
  AssociationMap[
   EntityProperty["Food", "Relative" <> # <> "Content"] &,
   Union @@ Normal[superfoodsDatset1[[All, "Nutrients"]]]]
Out[5]=
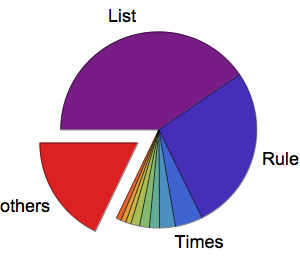
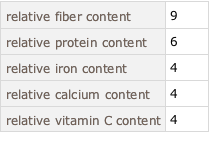
Dataset에서 가장 빈도가 높은 영양소를 찾습니다.
In[6]:=
mostCommonProperties =
 superfoodsDatset2[Counts[Flatten[#]] &, "Nutrients"][TakeLargest[5]]
Out[6]=
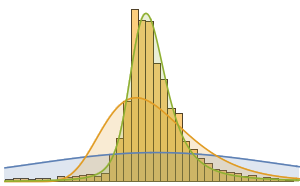
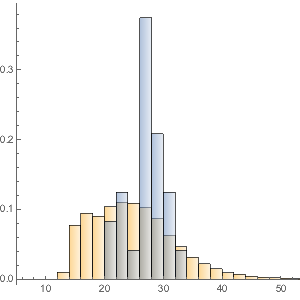
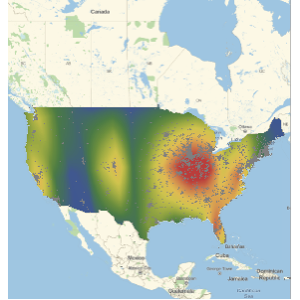
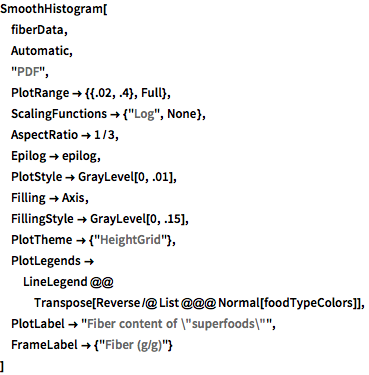
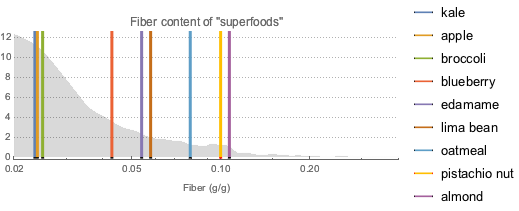
식이 섬유가 풍부하기로 유명한 슈퍼 푸드를 구하고, 약 9000 종류의 다른 식품과 비교하여 평활화 히스토그램으로 시각화합니다. 회색 곡선은 대부분의 식품의 식이 섬유의 확률 밀도 함수를 나타내고있다.
In[7]:=
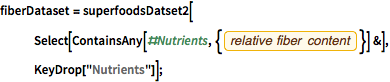
fiberDataset =
  superfoodsDatset2[
   Select[ContainsAny[#Nutrients, {EntityProperty["Food",
        "RelativeTotalFiberContent"]}] &], KeyDrop["Nutrients"]];
전체 Wolfram 언어 입력 표시하기
Out[13]=
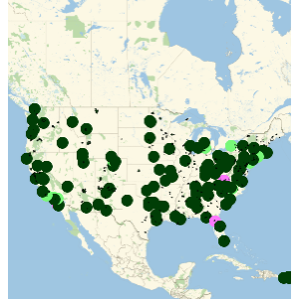
단백질이 풍부한 슈퍼 푸드에 대해서도 같은 작업을 반복합니다.
In[14]:=
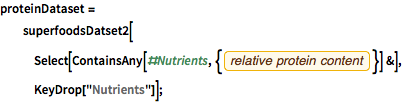
proteinDataset =
  superfoodsDatset2[
   Select[ContainsAny[#Nutrients, {EntityProperty["Food",
        "RelativeTotalProteinContent"]}] &], KeyDrop["Nutrients"]];
전체 Wolfram 언어 입력 표시하기
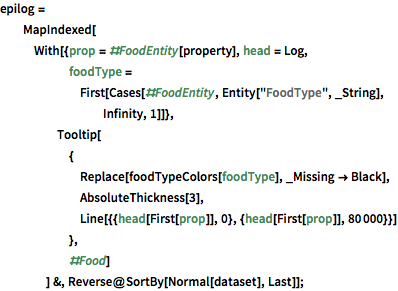
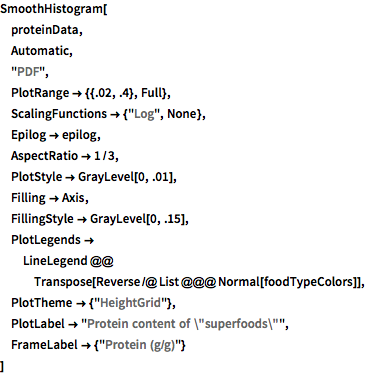
Out[21]=
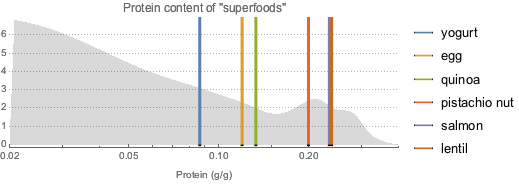
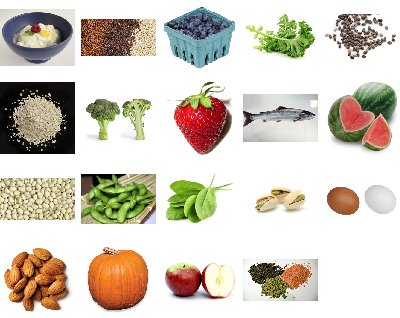
먼저 슈퍼 푸드의 이미지 집합을 만들고 슈퍼 푸드의 휘장을 생성합니다.
In[22]:=
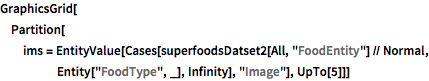
GraphicsGrid[
 Partition[
  ims = EntityValue[
    Cases[superfoodsDatset2[All, "FoodEntity"] // Normal,
     Entity["FoodType", _], Infinity], "Image"], UpTo[5]]]
Out[22]=
배경으로 잘 알려진 슈퍼맨의 형태를 사용합니다.
In[23]:=
Entity["Lamina", "SupermanInsigniaLamina"]["Image"] // ImageCropOut[23]=

간단한 이미지 처리를 사용하여 이를 배경으로 변환합니다.
In[24]:=
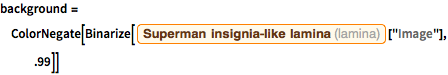
background =
 ColorNegate[
  Binarize[Entity["Lamina", "SupermanInsigniaLamina"]["Image"], .99]]
Out[24]=

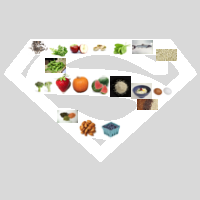
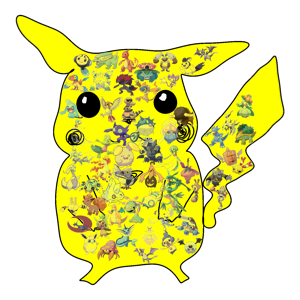
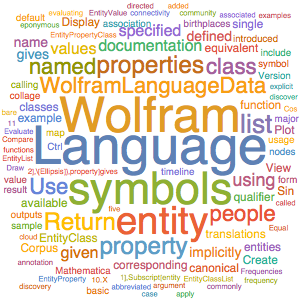
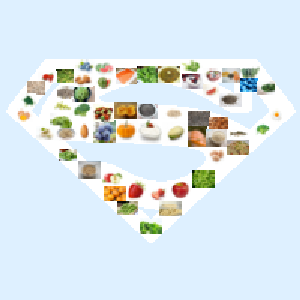
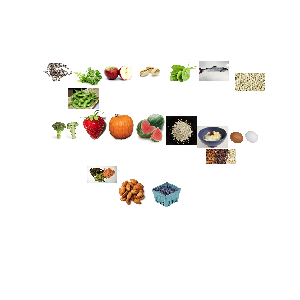
슈퍼 푸드의 "워드 클라우드"'를 생성합니다.
In[25]:=
wc = WordCloud[(RandomReal[{0.6, 1.2}] -> #) & /@ ims, background]Out[25]=
이 워드 클라우드와 배경을 결합합니다.
In[26]:=
ImageMultiply[{ColorReplace[background, Black -> LightGray], wc}]Out[26]=