연방 예금 보험 공사의 조직 데이터
연방 예금 보험 공사 (FDIC)는 미국내 금융 기관의 예금을 책임지는 미국 정부의 독립 기관입니다. 현재 가맹 기관의 예금은 25만 달러까지 보장하고 있습니다. 여기서는 가맹 금융 기관의 부동산, 크기 분포, 지리적 분산을 조사합니다.
먼저, FDIC 데이터의 엔티티 스토어를 ResourceObject로 로드합니다.
In[1]:=
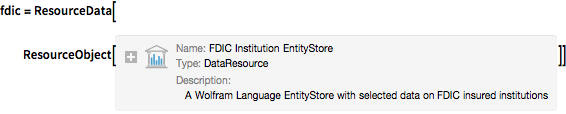
fdic = ResourceData[

ResourceObject[
Association[
   "Name" -> "FDIC Institution EntityStore",
    "UUID" -> "6f5d37d4-1406-483c-b67c-f58d903d16b1",
    "ResourceType" -> "DataResource", "Version" -> "1.0.0",
    "Description" -> "A Wolfram Language EntityStore with selected \
data on FDIC insured institutions",
    "ContentSize" -> Quantity[0, "Bytes"],
    "ContentElements" -> {"EntityStore"}]]]
Out[1]=
이 세션을 위해 스토어를 등록합니다.
In[2]:=
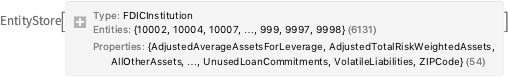
PrependTo[$EntityStores, fdic];FDIC의 회원 금융 기관 수를 찾습니다.
In[3]:=
Length[ents = EntityList["FDICInstitution"]]Out[3]=
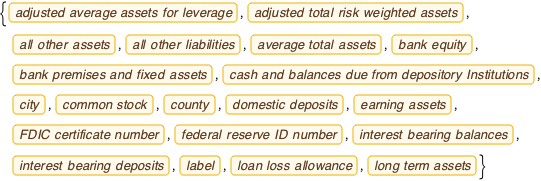
엔티티 스토어의 사용 가능한 특성 일부의 목록을 작성합니다.
In[4]:=
EntityProperties["FDICInstitution"] // Sort // Take[#, 20] &Out[4]=
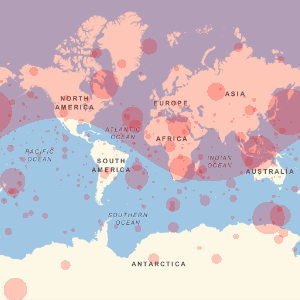
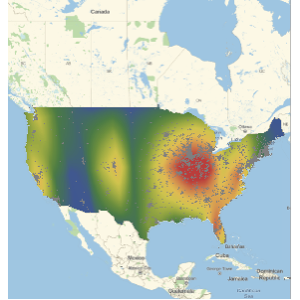
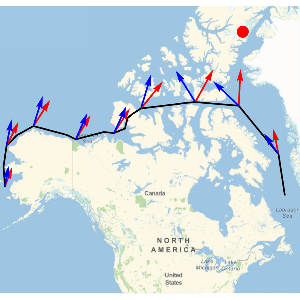
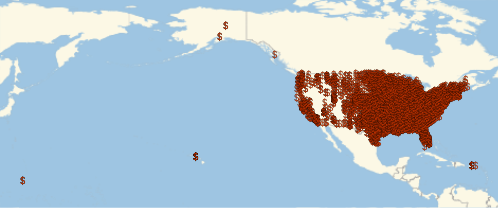
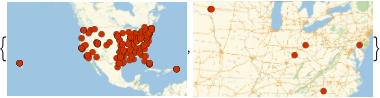
FDIC 가맹 은행의 지리적 위치를 시각화합니다.
In[5]:=
GeoListPlot[EntityList["FDICInstitution"], PlotMarkers -> "$"]Out[5]=
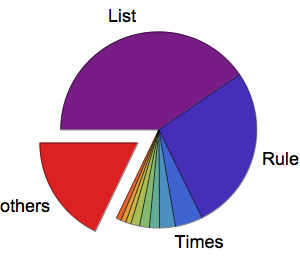
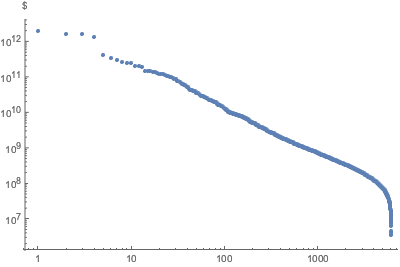
랭크 분포를 양대수 플롯으로 표시합니다.
In[6]:=
ListLogLogPlot[
 Reverse@Sort[EntityValue["FDICInstitution", "TotalAssets"]],
 AxesLabel -> Automatic, PlotStyle -> PointSize[Medium]]
Out[6]=
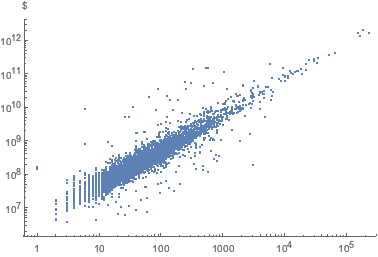
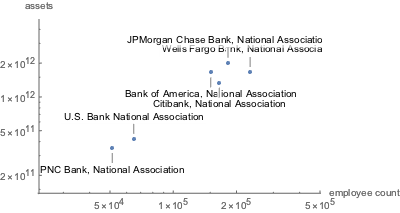
직원수 vs 자산을 플롯합니다.
In[7]:=
empVsAssets =
  EntityValue[
   "FDICInstitution", {"TotalEmployeeNumber", "TotalAssets"}];
In[8]:=
ListLogLogPlot[empVsAssets, AxesLabel -> Automatic]Out[8]=
규모가 가장 큰 6개 기관에 라벨을 붙입니다.
전체 Wolfram 언어 입력 표시하기
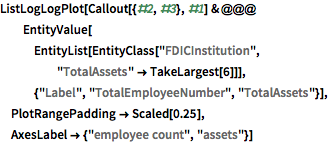
Out[9]=
부채 vs 자산을 플롯합니다.
In[10]:=
assetsVsLiability =
  EntityValue["FDICInstitution", {"TotalAssets", "TotalLiabilities"}];
In[11]:=
ListLogLogPlot[assetsVsLiability, AxesLabel -> Automatic]Out[11]=
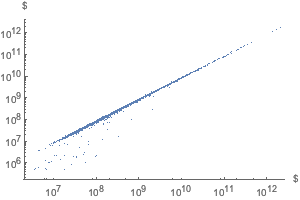
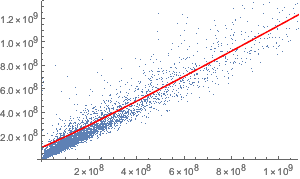
대출 총액, 차입 총액, 총 예금량을 적합도와 함께 플롯합니다.
In[12]:=
loanVsDeposit =
  EntityValue[
   "FDICInstitution", {"NetLoansAndLeases", "TotalDeposits"}];
In[13]:=
nmf = NonlinearModelFit[
  Select[QuantityMagnitude /@ loanVsDeposit, Min[#] > 0 &],
  c + a x^\[Alpha], {a, \[Alpha], c}, x]
Out[13]=
In[14]:=
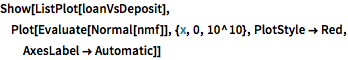
Show[ListPlot[loanVsDeposit],
 Plot[Evaluate[Normal[nmf]], {x, 0, 10^10}, PlotStyle -> Red,
  AxesLabel -> Automatic]]
Out[14]=
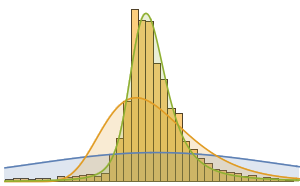
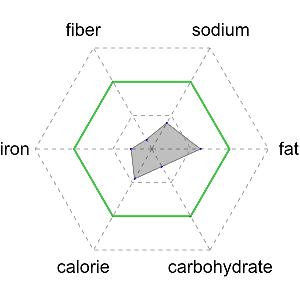
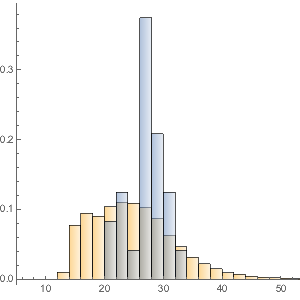
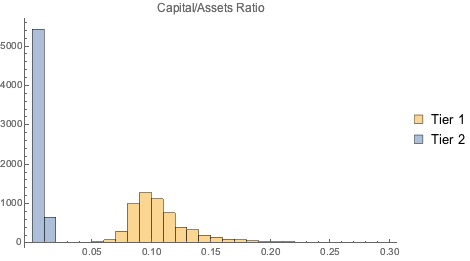
일급 자기 자본 (안전)과 보완적 자기 자본 (위험이 큰)을 총자산과 비교합니다.
In[15]:=
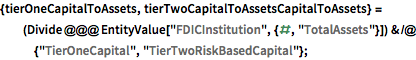
{tierOneCapitalToAssets,
   tierTwoCapitalToAssetsCapitalToAssets} = (Divide @@@
      EntityValue[
       "FDICInstitution", {#, "TotalAssets"}]) & /@ {"TierOneCapital",
     "TierTwoRiskBasedCapital"};
In[16]:=
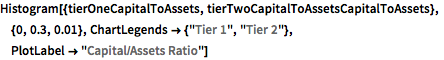
Histogram[{tierOneCapitalToAssets,
  tierTwoCapitalToAssetsCapitalToAssets}, {0, 0.3, 0.01},
 ChartLegends -> {"Tier 1", "Tier 2"},
 PlotLabel -> "Capital/Assets Ratio"]
Out[16]=
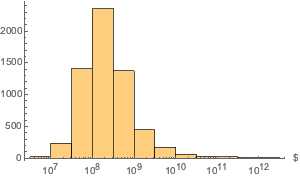
자산의 분포를 "EntityAssociation"로 추출합니다.
In[17]:=
dat = EntityValue["FDICInstitution", "TotalAssets",
   "EntityAssociation"];
자산 분포를 플롯합니다.
In[18]:=
Histogram[dat, "Log", AxesLabel -> Automatic]Out[18]=
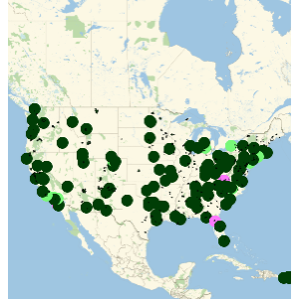
자산이 50억 달러 이상인 은행과 3000억 달러 이상인 은행의 위치를 표시합니다.
In[19]:=
GeoListPlot[
   Keys[Select[dat,
     GreaterThan[Quantity[#, "USDollars"]]]]] & /@ {5*^9, 300*^9}
Out[19]=
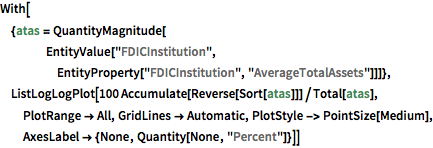
상위 10개 은행이 나머지 6,121개 은행을 합친 것보다 많은 자산을 보유하는 것을 그래픽으로 나타냅니다.
전체 Wolfram 언어 입력 표시하기
Out[20]=
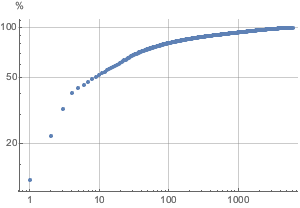
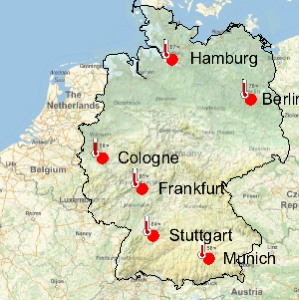
예금량이 상위 1%인 은행을 찾습니다.
In[21]:=
dat1 = EntityValue["FDICInstitution", "TotalDeposits",
   "EntityAssociation"];
In[22]:=
{bottom1percent, top1percent} =
 Quantile[values = Values[dat1], {0.01, 0.99}]
Out[22]=
지도에 플롯합니다.
In[23]:=
GeoListPlot[Keys[Select[dat1, GreaterThan[top1percent]]]]Out[23]=
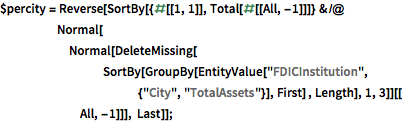
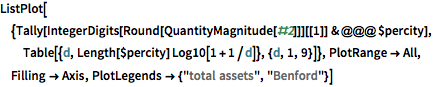
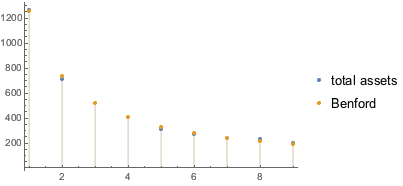
도시별 자산 분포는 벤포드의 법칙과 놀라울 정도로 일치합니다.
전체 Wolfram 언어 입력 표시하기
Out[25]=
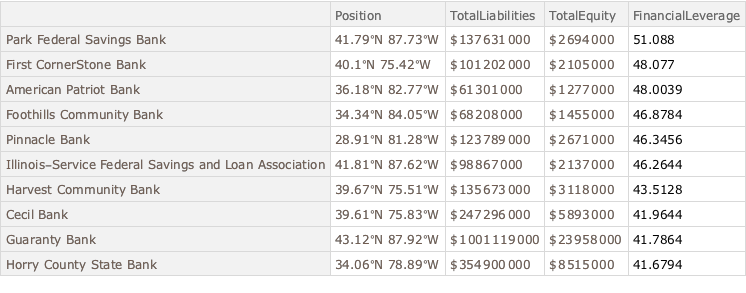
재무 레버리지가 큰 은행을 나타냅니다.
전체 Wolfram 언어 입력 표시하기
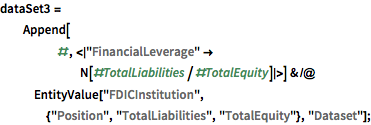
In[27]:=
dataSet3[TakeLargestBy["FinancialLeverage", 10]]Out[27]=
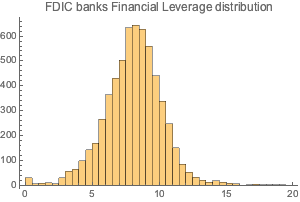
재무 레버리지의 분포를 플롯합니다.
In[28]:=
Histogram[dataSet3[All, "FinancialLeverage"], {0, 20, 0.5},
 PlotLabel -> "FDIC banks Financial Leverage distribution"]
Out[28]=
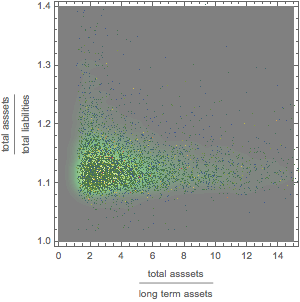
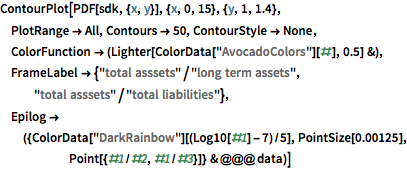
자산, 장기 자산, 부채의 관계를 그래픽으로 나타냅니다.
전체 Wolfram 언어 입력 표시하기
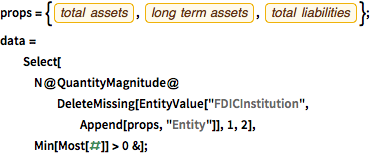
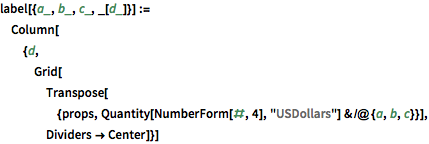
Out[33]=