날씨 예보
Wolfram Knowledgebase는 정적 지식뿐만 아니라 실시간 데이터도 포함하고 있으며, 날씨 관련 미래 이벤트 등도 예측할 수 있습니다. 이 예에서는 WeatherForecastData를 사용하여 예보를 도출하여 AirTemperatureData에 포함된 과거의 값과 비교하여 결과를 다양하게 시각화하여 제공합니다.
자유 형식 입력으로 지정된 그린란드 수도의 이번 주 평균 기온 예보를 반환합니다.
In[1]:=
forecast = WeatherForecastData[\!\(\*
NamespaceBox["LinguisticAssistant",
DynamicModuleBox[{Typeset`query$$ = "greenland capital",
      Typeset`boxes$$ = RowBox[{
TemplateBox[{"\"Greenland\"",
RowBox[{"Entity", "[",
RowBox[{"\"Country\"", ",", "\"Greenland\""}], "]"}],
          "\"Entity[\\\"Country\\\", \\\"Greenland\\\"]\"",
          "\"country\""}, "Entity"], "[",
TemplateBox[{"\"capital city\"",
RowBox[{"EntityProperty", "[",
RowBox[{"\"Country\"", ",", "\"CapitalCity\""}], "]"}],
          "\"EntityProperty[\\\"Country\\\", \\\"CapitalCity\\\"]\""},
          "EntityProperty"], "]"}], Typeset`allassumptions$$ = {},
      Typeset`assumptions$$ = {}, Typeset`open$$ = {1},
      Typeset`querystate$$ = {
      "Online" -> True, "Allowed" -> True,
       "mparse.jsp" -> 0.449168`6.10395380181902, "Messages" -> {}}},

DynamicBox[ToBoxes[
AlphaIntegration`LinguisticAssistantBoxes["", 4, Automatic,
Dynamic[Typeset`query$$],
Dynamic[Typeset`boxes$$],
Dynamic[Typeset`allassumptions$$],
Dynamic[Typeset`assumptions$$],
Dynamic[Typeset`open$$],
Dynamic[Typeset`querystate$$]], StandardForm],
ImageSizeCache->{121., {7., 16.}},
TrackedSymbols:>{
        Typeset`query$$, Typeset`boxes$$, Typeset`allassumptions$$,
         Typeset`assumptions$$, Typeset`open$$, Typeset`querystate$$}],
DynamicModuleValues:>{},
UndoTrackedVariables:>{Typeset`open$$}],
BaseStyle->{"Deploy"},
DeleteWithContents->True,
Editable->False,
SelectWithContents->True]\), "Temperature"]
Out[1]=
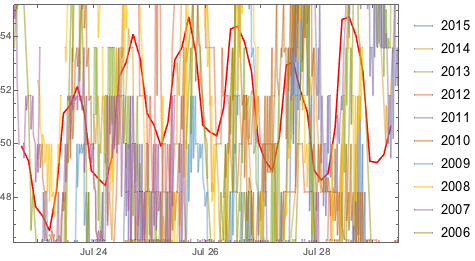
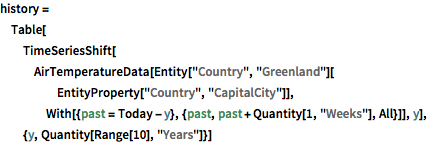
지난 10년간의 주간 평균 기온을 가져와 그 이전 10년과 비교합니다.
전체 Wolfram 언어 입력 표시하기
Out[3]=

다른 두 도시를 둘러싼 지역의 기온 범위의 차이를 조사하고 비교합니다.
In[4]:=

Table[WeatherForecastData[
  GeoDisk[city[EntityProperty["City", "Position"]],
   Quantity[100, "Miles"]], "Temperature",
  DateObject[
   Tomorrow, {12}]], {city, {Entity[
    "City", {"Champaign", "Illinois", "UnitedStates"}],
   Entity["City", {"SanFrancisco", "California", "UnitedStates"}]}}]
Out[4]=
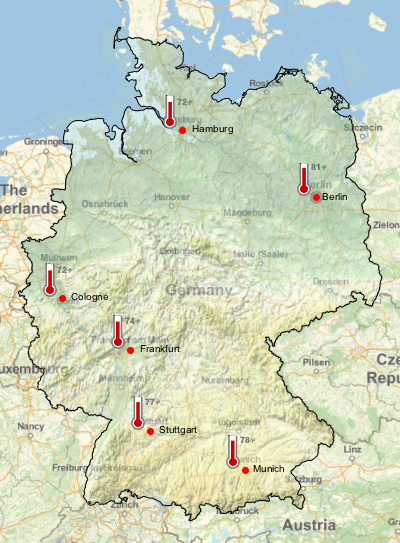
독일의 6개 대도시의 목록을 작성하고 각 도시의 오늘의 최고 기온의 예측을 얻습니다.
In[5]:=

cities = EntityClass[
   "City", {"Country" -> "Germany", "Population" -> TakeLargest[6]}] //
   EntityList
Out[5]=
In[6]:=

data = {CityData[#, "Coordinates"], CityData[#, "Name"],
     WeatherForecastData[#, "MaxTemperature"]["FirstValue"]} & /@
   cities;
지도에 시각화합니다.
전체 Wolfram 언어 입력 표시하기
Out[7]=


