Visualisieren Sie Ernährung nach der empfohlenen Tagesmenge
Die Wolfram Knowledgebase enthält nicht nur detaillierte Eigenschaften und Nährwertangaben für mehr als 37.000 "Food"- und 1000 "FoodType"- Entitäten, sondern auch Daten zu empfohlenen Tagesmenge für 176 Nährstoffe. In Kombination ermöglichen diese umfassenden Datensätze die berechnungsbasierte Untersuchung der Nährwerte nahezu jeder Mahlzeit, sowie deren Veranschaulichung in einer einfachen Graphik.
EntityValue["Nutrient", "EntityCount"]Rufen Sie eine Liste von empfohlener Tagesmengen für Nährstoffe basierend auf einer Kalorienzufuhr von 2000 Kalorien/Tag.
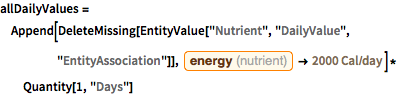
allDailyValues =
 Append[DeleteMissing[
    EntityValue["Nutrient", "DailyValue", "EntityAssociation"]],
   Entity["Nutrient", "Energy"] ->
    Quantity[2000, ("LargeCalories")/("Days")]]*Quantity[1, "Days"]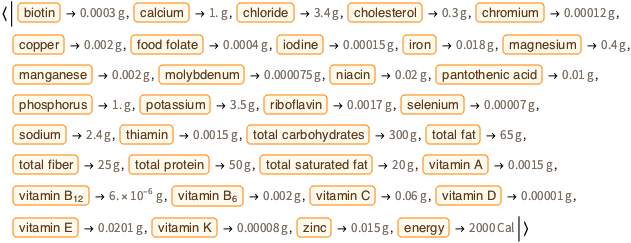
Ordnen Sie Lebensmitteleigenschaften Nährstoffen zu.
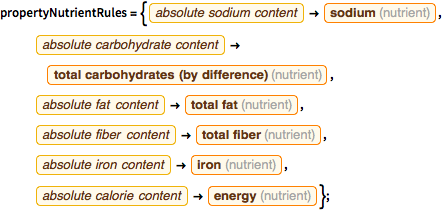
propertyNutrientRules = {EntityProperty["Food",
     "AbsoluteSodiumContent"] -> Entity["Nutrient", "Sodium"],
   EntityProperty["Food", "AbsoluteTotalCarbohydratesContent"] ->
    Entity["Nutrient", "TotalCarbohydrates"],
   EntityProperty["Food", "AbsoluteTotalFatContent"] ->
    Entity["Nutrient", "TotalFat"],
   EntityProperty["Food", "AbsoluteTotalFiberContent"] ->
    Entity["Nutrient", "TotalFiber"],
   EntityProperty["Food", "AbsoluteIronContent"] ->
    Entity["Nutrient", "Iron"],
   EntityProperty["Food", "AbsoluteTotalCaloriesContent"] ->
    Entity["Nutrient", "Energy"]};
Untersuchen Sie ein typisches Frühstück mit EntityGroup und EntityInstance.
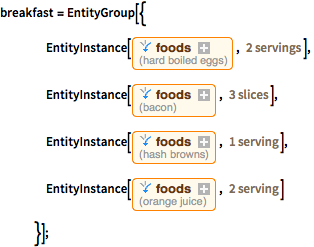
breakfast = EntityGroup[{
EntityInstance[Entity[
"Food", {
EntityProperty["Food", "CookingMethod"] -> Entity[
"CookingMethod", "HardBoiled"],
EntityProperty["Food", "FoodType"] -> ContainsExactly[{
Entity["FoodType", "Egg"]}],
EntityProperty[
"Food", "AddedFoodTypes"] -> ContainsExactly[{}]}],
Quantity[2, "Servings"]],
EntityInstance[Entity[
"Food", {EntityProperty["Food", "FoodType"] -> ContainsExactly[{
Entity["FoodType", "Bacon"]}],
EntityProperty[
"Food", "AddedFoodTypes"] -> ContainsExactly[{}]}],
Quantity[3, "Slices"]],
EntityInstance[Entity[
"Food", {EntityProperty["Food", "FoodType"] -> ContainsExactly[{
Entity["FoodType", "HashBrown"]}],
EntityProperty[
"Food", "AddedFoodTypes"] -> ContainsExactly[{}]}],
Quantity[1, "Servings"]],
EntityInstance[Entity[
"Food", {EntityProperty["Food", "FoodType"] -> ContainsExactly[{
Entity["FoodType", "OrangeJuice"]}],
EntityProperty[
"Food", "AddedFoodTypes"] -> ContainsExactly[{}]}],
Quantity[2, "Servings"]]
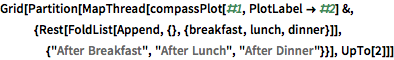
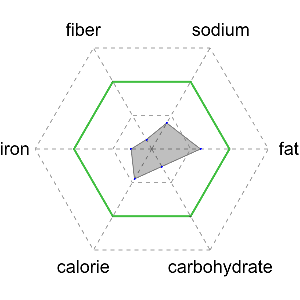
}];Visualisieren Sie den Nährwert einer Mahlzeit in Prozent der empfohlenen Tagesmenge im Look eines Kompasses: Die ineinander verschachtelten Sechsecke markieren 50%, 100% (in grün) und 150% der empfohlenen Tagesmenge für sechs Hauptnährstoffe.
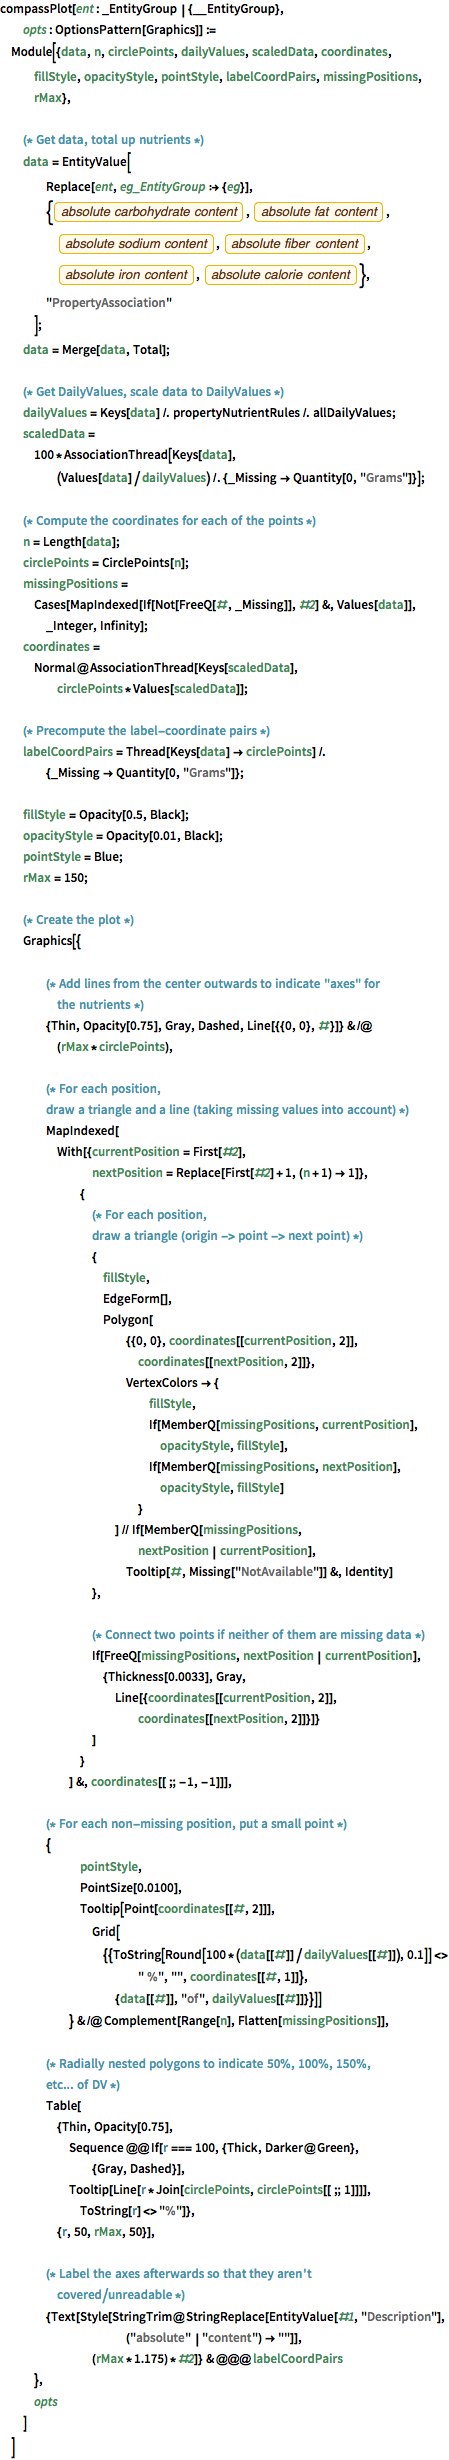
compassPlot[breakfast]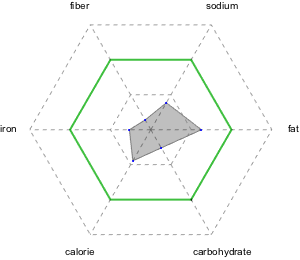
Untersuchen Sie nun neben dem Frühstück auch noch die Mittags- und Abendmahlzeiten.
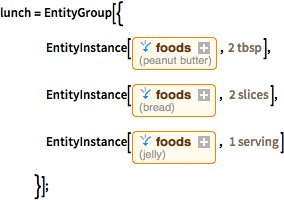
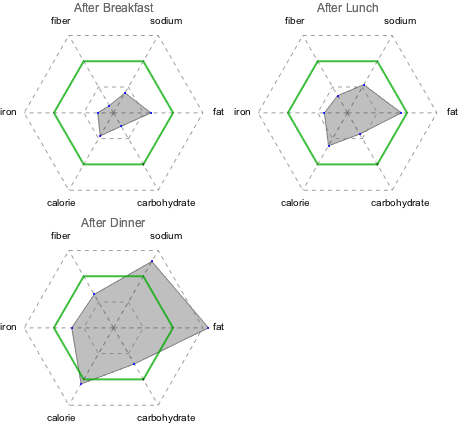
lunch = EntityGroup[{
    EntityInstance[Entity[
     "Food", {EntityProperty["Food", "FoodType"] -> ContainsExactly[{
Entity["FoodType", "PeanutButter"]}],
       EntityProperty[
        "Food", "AddedFoodTypes"] -> ContainsExactly[{}]}],
     Quantity[2, "Tablespoons"]],
    EntityInstance[Entity[
     "Food", {EntityProperty["Food", "FoodType"] -> ContainsExactly[{
Entity["FoodType", "Bread"]}],
       EntityProperty[
        "Food", "AddedFoodTypes"] -> ContainsExactly[{}]}],
     Quantity[2, "Slices"]],
    EntityInstance[Entity[
     "Food", {EntityProperty["Food", "FoodType"] -> ContainsExactly[{
Entity["FoodType", "Jelly"]}],
       EntityProperty[
        "Food", "AddedFoodTypes"] -> ContainsExactly[{}]}],
     Quantity[1, "Servings"]]
    }];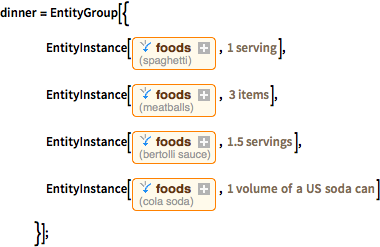
dinner = EntityGroup[{
    EntityInstance[Entity[
     "Food", {EntityProperty["Food", "FoodType"] -> ContainsExactly[{
Entity["FoodType", "Spaghetti"]}],
       EntityProperty[
        "Food", "AddedFoodTypes"] -> ContainsExactly[{}]}],
     Quantity[1, "Servings"]],
    EntityInstance[Entity[
     "Food", {EntityProperty["Food", "FoodType"] -> ContainsExactly[{
Entity["FoodType", "Meatball"]}],
       EntityProperty[
        "Food", "AddedFoodTypes"] -> ContainsExactly[{}]}],
     Quantity[3, "Items"]],
    EntityInstance[Entity[
     "Food", {
      EntityProperty["Food", "BrandName"] -> Entity[
        "FoodBrandName", "Bertolli"],
       EntityProperty["Food", "FoodType"] -> ContainsExactly[{
Entity["FoodType", "Sauce"]}],
       EntityProperty[
        "Food", "AddedFoodTypes"] -> ContainsExactly[{}]}],
     Quantity[1.5, "Servings"]],
    EntityInstance[Entity[
     "Food", {
      EntityProperty["Food", "Flavor"] -> Entity[
        "FoodFlavor", "Cola"],
       EntityProperty["Food", "FoodType"] -> ContainsExactly[{
Entity["FoodType", "CarbonatedBeverage"]}],
       EntityProperty[
        "Food", "AddedFoodTypes"] -> ContainsExactly[{}]}],
     Quantity[1, "USSodaCanVolumes"]]
    }];
Visualisieren Sie den abgedeckten Nährwertbedarf nach jeder Mahlzeit.