Visualize Essential Singularities
Use complex plotting utilities to visualize essential singularities in different ways.
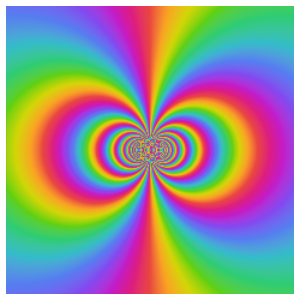
Define a function with an essential singularity.
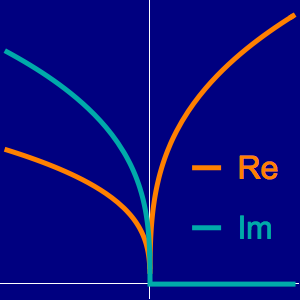
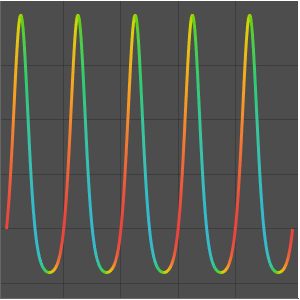
As a function of a real variable,  oscillates infinitely quickly near
  . From ReImPlot, you can see that both the real and imaginary show similar behavior as they approach the origin.
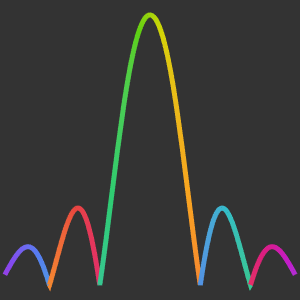
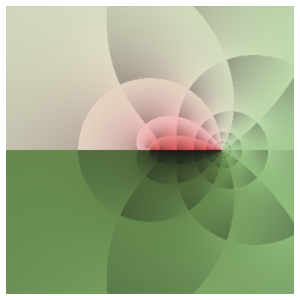
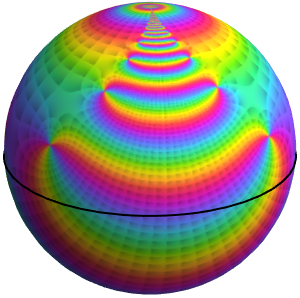
The oscillations are also shown by AbsArgPlot, which also shows that the absolute value approaches zero at constant rates from either side.
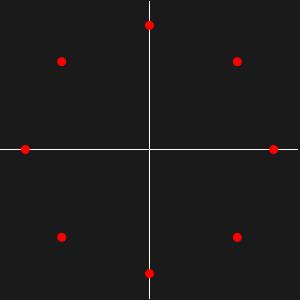
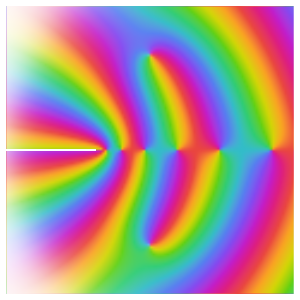
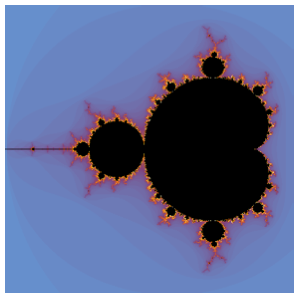
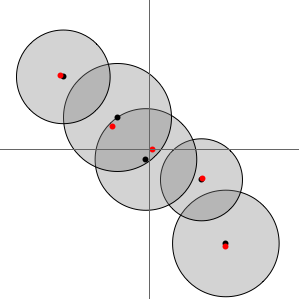
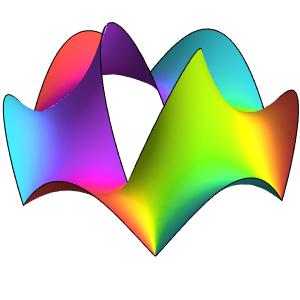
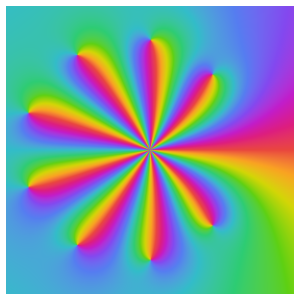
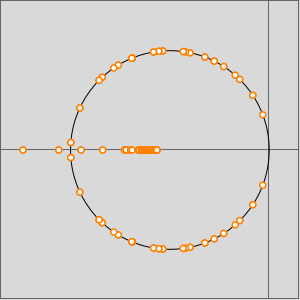
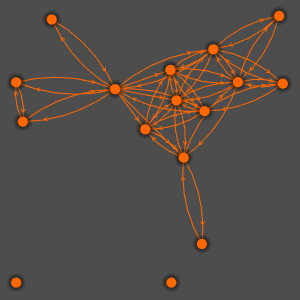
Based on the behavior along the real axis, it might be thought that the function converges to zero at the origin. Looking at the behavior over the complex numbers shows this is not the case, however, since the function actually has an essential singularity there.