WolframGeographyA Core Part of
Wolfram Language

Analyze, Compute and Visualize Geographic Data.
Make geography computable with curated geographic data, precise computation and automated visualization. For beginners to experts, easily convert your data into insightful and great-looking maps.
Rich Geo Backgrounds
Use a wide range of different map types for backgrounds, orientation and discovery. Choose from street maps, elevation maps, contour maps, satellite imagery and more. Worldwide coverage, high-resolution features and high-quality vector and raster renderings are all available in 150+ different projections.

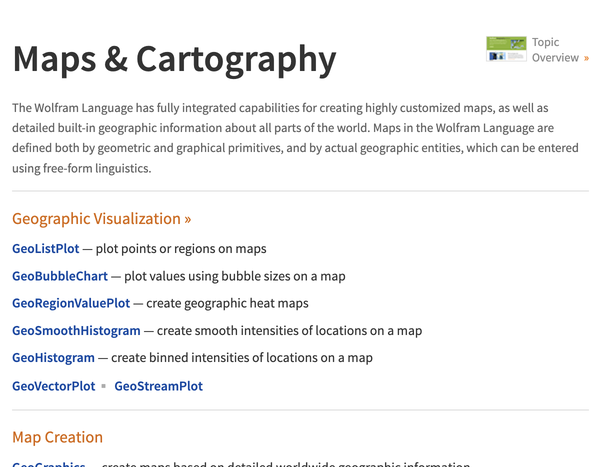
Geo Visualization
Answer the "where" as well as the "why." Visualize scalar, vector, graph and density data overlaid on maps for immediate spatial insight into what happens where. Build on robust geo computation, automated visualization and an extensive knowledgebase for rich and easy-to-use geo visualization.

Precise Geo Computation
Trust your geographic analysis with robust and precise computation of locations, distances, areas, etc. for information such as administrative borders, land ownership and driving directions. Use advanced algorithms on current models of the Earth as well as high-resolution geo data.

Geo Data
Improve and extend your maps with relevant, up-to-date, already geo-tagged information. Curated socio-economic and historical data; geophysical and weather information; administrative boundaries, rivers or roads are all immediately accessible in a simple, consistent and systematic way.

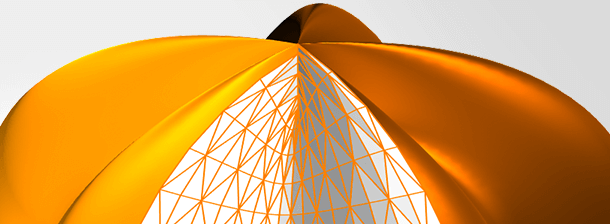
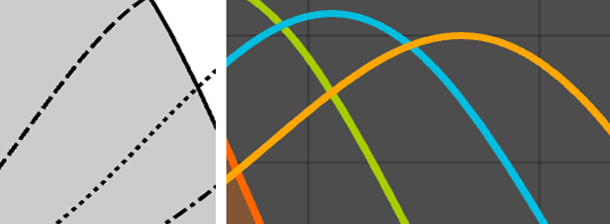
Geo Projections
Project the Earth to the screen in more than 150 different ways. Make maps that emphasize different features (distances, directions, areas, ...) of your data. Choose the most appropriate projection for your map, specifying centering, scales and other parameters, or let GeoGraphics choose it for you.

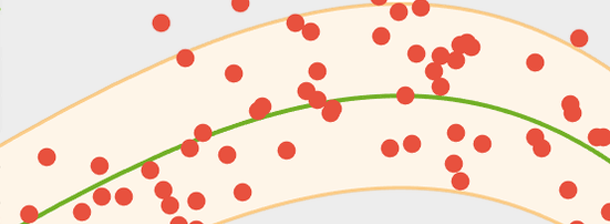
Geo Statistics
Analyze, summarize and understand the abundant geospatial data across the world, including point data (trees, crime locations, earthquakes, ...) and field data (temperature, soil nutrition level, magnetic field, ...). Use point pattern analysis to characterize centers, densities and dispersion, and spatial estimation to predict values everywhere.

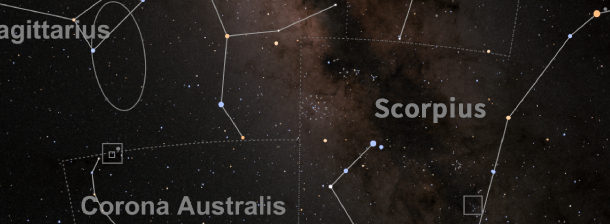
Maps of Celestial Bodies
Boldly go where no map has gone before. Use satellite imagery or elevation data to construct faithful representations of the geography of large celestial bodies, like Earth's Moon or the solid planets of the solar system. Apply the full suite of tools available for Earth geography to planetary geography.

Wolfram Geography Documentation
Wolfram Geography is an integrated part of Wolfram Language. The full system contains over 6,000 built-in functions covering all areas of computation—all carefully integrated so they work perfectly together.
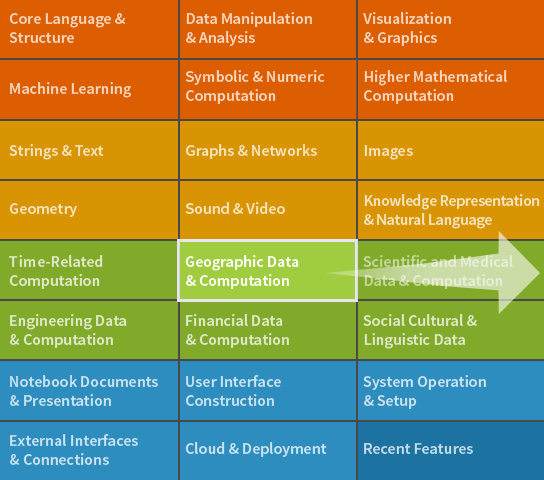
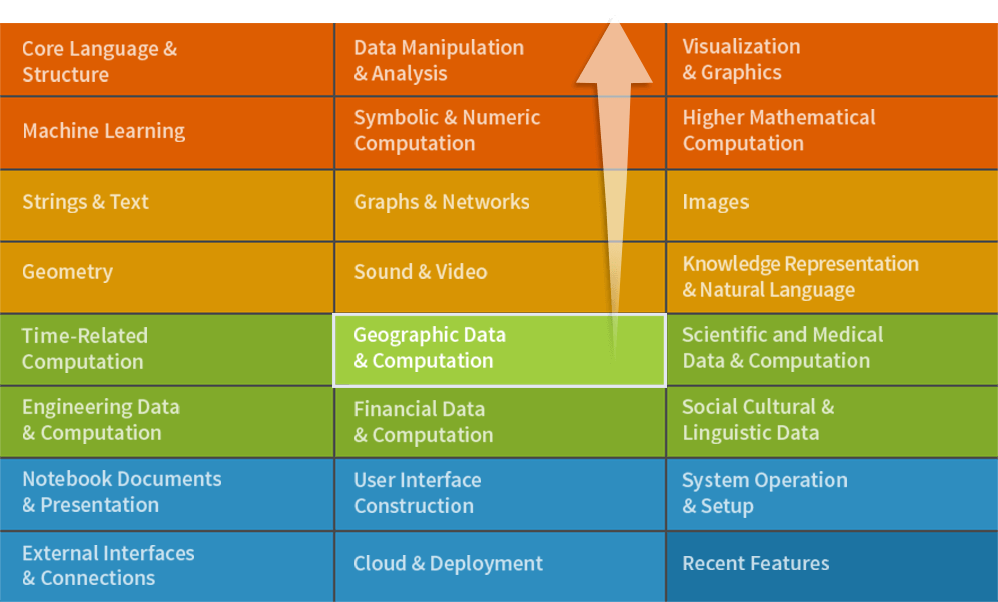
Full Scope & Documentation
 Guide
Guide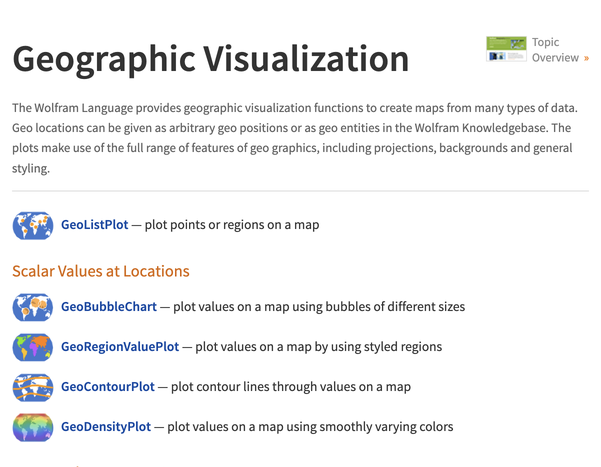 Guide
Guide Guide
Guide