| 6 | Making Tables |
We’ve seen a few ways to make lists in the Wolfram Language. You can just type them in. You can use Range. And you can use functions like IntegerDigits. One of the most common and flexible ways to make lists is with the function Table.
In its very simplest form, Table makes a list with a single element repeated some specified number of times.
Make a list that consists of 5 repeated 10 times:
In[1]:=
Out[1]=
This makes a list with x repeated 10 times:
In[2]:=
Out[2]=
You can repeat lists too:
In[3]:=
Out[3]=
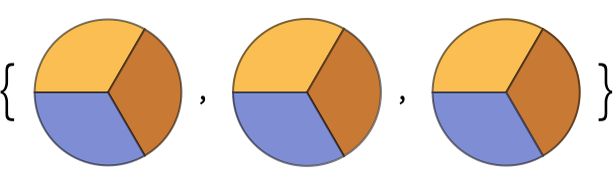
Or, actually, anything; here’s a list of 3 identical pie charts:
In[4]:=
Out[4]=
But what if we want to make a table where the elements aren’t identical? We can do that by introducing a variable, and then iterating over that variable.
Iterate over n to make a list where n goes up to 5:
In[5]:=
Out[5]=
Here’s how this works. To make the first element of the list, n is taken to be 1, so a[n] is a[1]. To make the second element, n is taken to be 2, so a[n] is a[2], and so on. n is called a variable because it’s varying as we make the different elements of the list.
Make a table that gives the value of n+1 when n goes from 1 to 10:
In[6]:=
Out[6]=
In[7]:=
Out[7]=
With Table, you can make tables of anything.
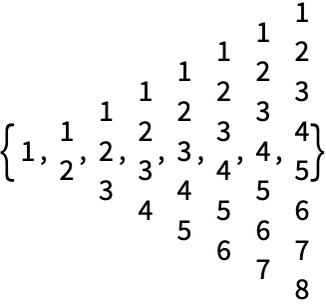
Here’s a table of successively longer lists produced by Range:
In[8]:=
Out[8]=
Here each of the lists produced is shown as a column:
In[9]:=
Out[9]=
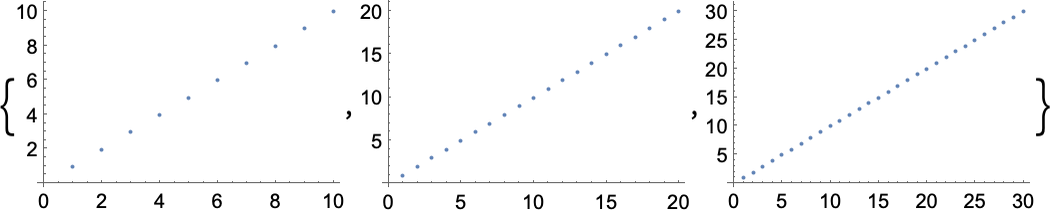
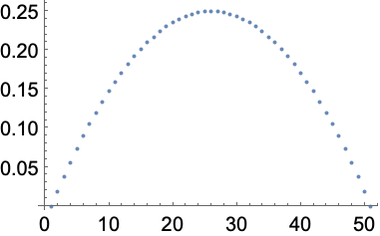
Here’s a table of plots of successively longer lists of values:
In[10]:=
Out[10]=
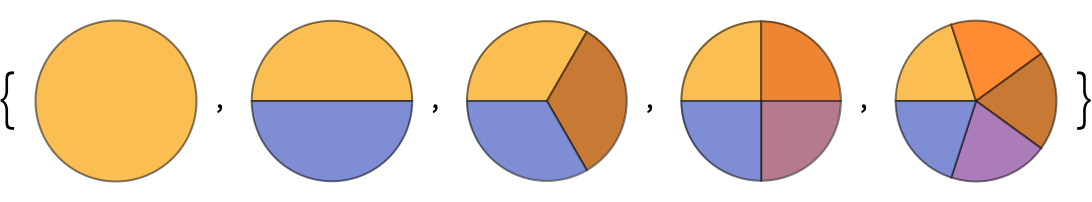
Here are pie charts with successively more segments:
In[11]:=
Out[11]=
So far we’ve always used n as our variable. That’s a pretty common choice. But we can actually use any (lowercase) letter we want, or any combination of letters. All that matters is that wherever the variable appears, its name is the same.
In[12]:=
Out[12]=
Here we’re using x as the variable name, and it happens to appear several times:
In[13]:=
Out[13]=
In Table[f[n], {n, 5}], n takes on values 1, 2, 3, 4, 5. Table[f[n], {n, 3, 5}] says to start at 3 instead: 3, 4, 5.
This generates a table with n going from 1 to 10:
In[14]:=
Out[14]=
This generates a table with n going from 4 to 10:
In[15]:=
Out[15]=
This makes n go from 4 to 10 in steps of 2:
In[16]:=
Out[16]=
The Wolfram Language emphasizes consistency, so for example Range is set up to deal with starting points and steps just like Table.
Generate the range of numbers 4 to 10:
In[17]:=
Out[17]=
Generate the range of numbers 4 to 10 going in steps of 2:
In[18]:=
Out[18]=
Go from 0 to 1 in steps of 0.1:
In[19]:=
Out[19]=
There are usually many ways to do the same thing in the Wolfram Language. For example, here’s how Table and Range can produce identical plots.
Generate a table and plot it:
In[20]:=
Out[20]=
Get the same result by doing arithmetic with the range of values:
In[21]:=
Out[21]=
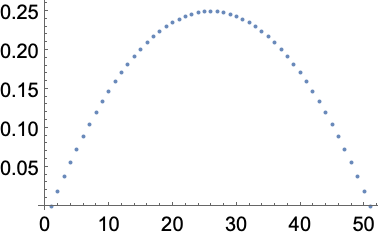
Table always separately computes each entry in the list it generates—and you can see this if you use RandomInteger in Table.
This generates 20 independent random integers with size up to 10:
In[22]:=
Out[22]=
RandomInteger can actually also generate the list directly.
This again generates 20 random integers with size up to 10:
In[23]:=
Out[23]=
| Table[x,5] | list of 5 copies of x | |
| Table[ f[n],{n,10}] | list of values of f[n] with n going up to 10 | |
| Table[ f[n],{n,2,10}] | list of values with n going from 2 to 10 | |
| Table[ f[n],{n,2,10,4}] | list of values with n going from 2 to 10 in steps of 4 | |
| Range[5,10] | list of numbers from 5 to 10 | |
| Range[10,20,2] | list of numbers from 10 to 20 in steps of 2 | |
| RandomInteger[10,20] | list of 20 random integers up to 10 |
6.1Make a list in which the number 1000 is repeated 5 times. »

6.3Make a number line plot of the first 20 squares. »
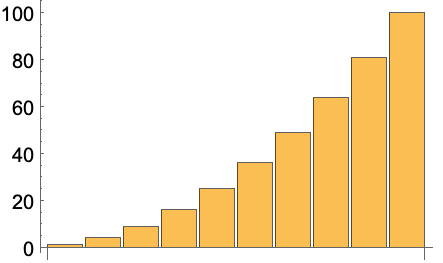
6.6Make a bar chart of the first 10 squares. »
6.7Make a table of lists of digits for the first 10 squares. »
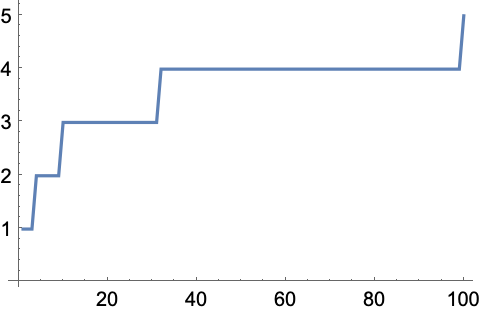
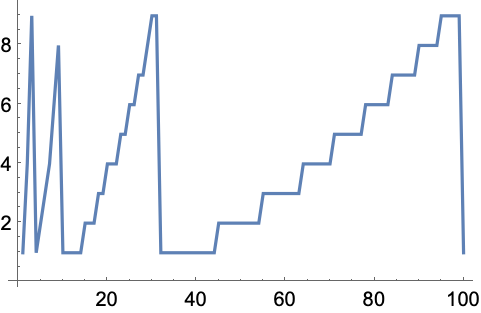
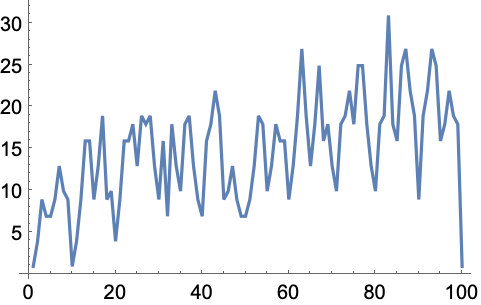
6.8Make a list line plot of the length of the sequence of digits for each of the first 100 squares. »
6.9Make a table of the first digit of the first 20 squares. »
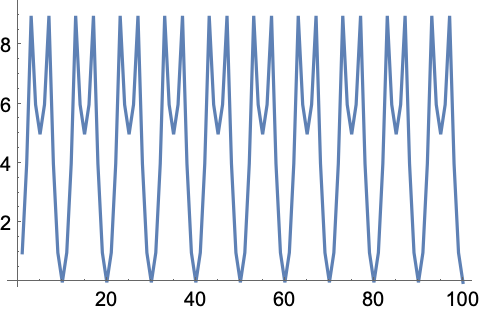
6.10Make a list line plot of the first digits of the first 100 squares. »
+6.2Make a list of the odd numbers (1, 3, 5, ...) up to 100. »
+6.3Make a list of the squares of even numbers up to 100. »

+6.5Make a list for numbers n up to 20 in which each element is a column of the values of n, n^2 and n^3. »

+6.6Make a list line plot of the last digits of the first 100 squares. »
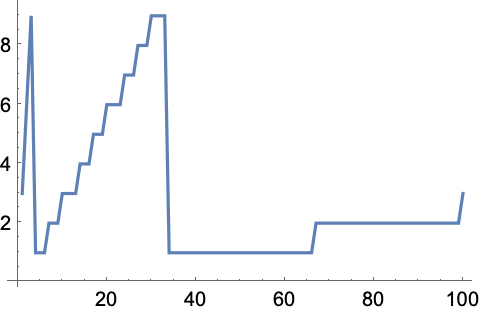
+6.7Make a list line plot of the first digit of the first 100 multiples of 3. »
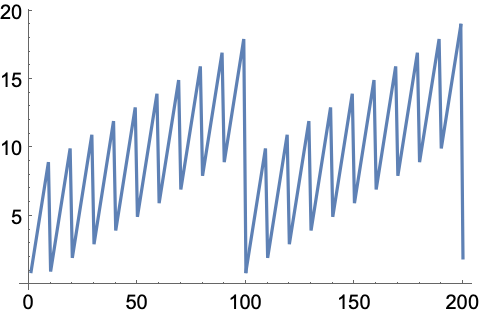
+6.8Make a list line plot of the total of the digits for each number up to 200. »
+6.9Make a list line plot of the total of the digits for each of the first 100 squares. »
What does the { ...} (list) in Table[n^2, {n, 5}] mean?
A list is always a way of collecting things together. Here what it’s collecting is the variable n and its range 5. In the Wolfram Language, this kind of use of a list is called an iterator specification.
Why is the { ...} (list) in Table[n^2, {n, 5}] needed?
So one can easily generalize to multidimensional arrays, like Table[x^2-y^2, {x, 5}, {y, 5}].
What are the constraints on the names of variables?
They can be any sequence of letters or numbers, but they can’t start with a number, and—to avoid possible confusion with built-in Wolfram Language functions—they shouldn’t start with a capital letter.
Why do you have to name a variable if the name never matters?
Good question! In Section 26, we’ll see how to avoid having named variables. It’s very elegant, but it’s a little more abstract than what we’re doing with Table here.
Can Range deal with negative numbers?
Yes. Range[-2, 2] gives {-2, -1, 0, 1, 2}. Range[2, -2] gives {}, but Range[2, -2, -1] gives {2, 1, 0, -1, -2}.
- If you specify steps that don’t fit evenly in the range you give, Range and Table just go as far as the steps take them, potentially stopping before the upper limit. (So Range[1, 6, 2] gives {1, 3, 5}, stopping at 5, not 6.)
- Table[f[n], {n, {v1, v2, v3...}}] lets you make a table using whatever values of n you want; here you would get {f[v1], f[v2], f[v3], ...}. In Section 25, we’ll see how to get the same result with Map.