Vector Joint Model versus Univariate Component Models
Get hourly temperature readings for May 2014 in Champaign, Illinois.
| In[1]:= | X |
| In[2]:= | 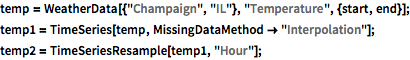 X |
Use TimeSeriesAggregate to calculate daily minimum and maximum temperatures.
| In[3]:= | X |
Combine them into a vector time series.
| In[4]:= | 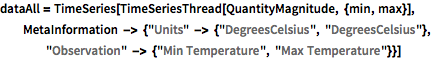 X |
| Out[4]= |
| Out[5]= | 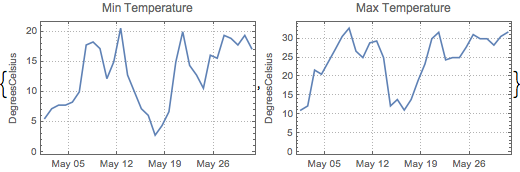 |
The first part of the data will be used to find a model, while the rest of the data will serve as a reference set for the forecast.
| In[6]:= | X |
The temperatures are cross-correlated.
| In[7]:= | X |
| Out[7]= | 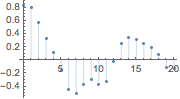 |
Fit a vector model to the data.
| In[8]:= | X |
| Out[8]= |
Forecast the next 5 days.
| In[9]:= | X |
| Out[10]= | 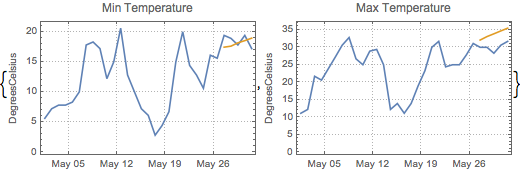 |
Find univariate models of the same type but longer orders for both temperatures separately.
| In[11]:= | 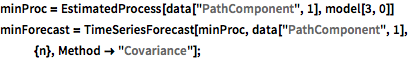 X |
| Out[11]= |
| In[12]:= | 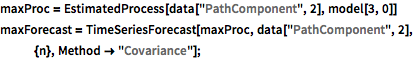 X |
| Out[12]= |
Combine univariate forecasts for plotting.
| In[13]:= | 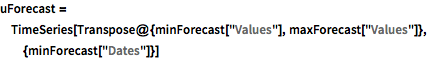 X |
| Out[13]= |
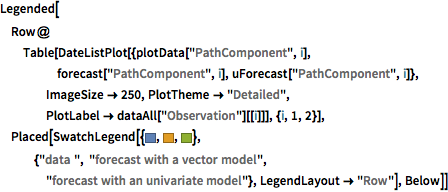
Compare the forecasts.
| In[14]:= | X |
| Out[15]= | 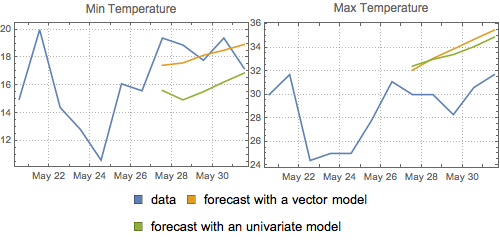 |
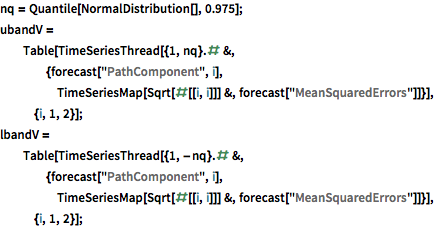
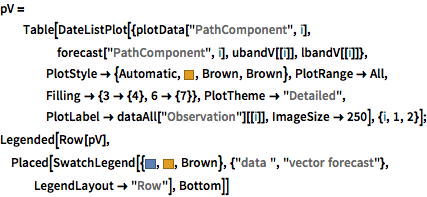
Plot the vector forecast and the 95% confidence bands.
| Out[17]= | 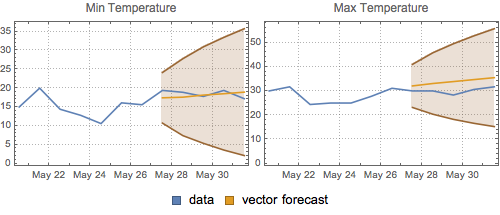 |
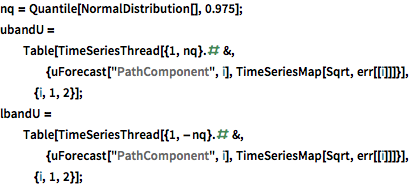
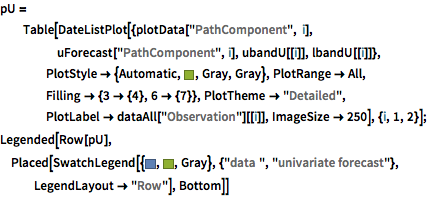
Plot the univariate forecasts and the 95% confidence bands.
| Out[20]= | 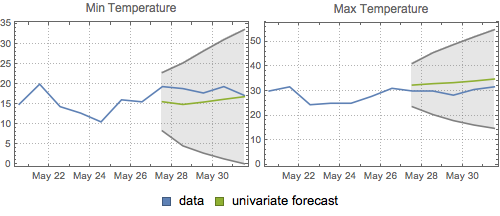 |
Compare both forecasts and the corresponding confidence bands.
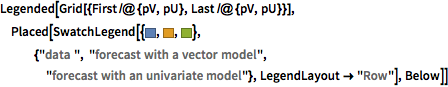
| Out[21]= | 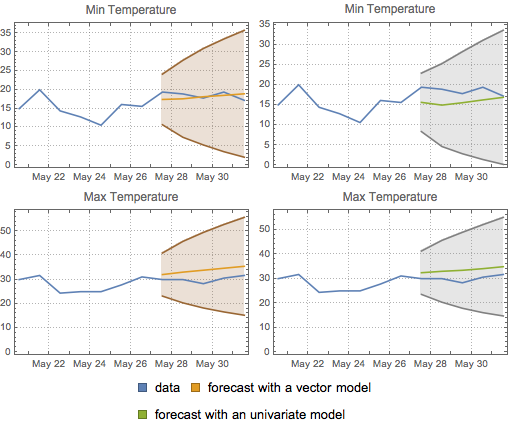 |