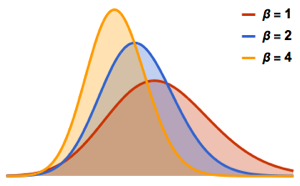
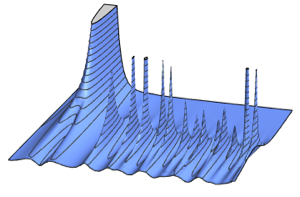
Marchenko–Pastur Distribution
Marchenko–Pastur distribution is the limiting distribution of eigenvalues of Wishart matrices as the matrix dimension  and degrees of freedom
  both tend to infinity with ratio
  . For
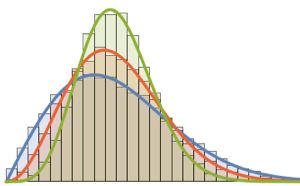
. For  , the distribution has no point mass and the probability density function is well-defined.
PDF[MarchenkoPasturDistribution[1/2], x]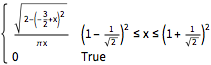

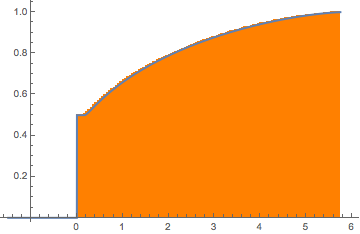
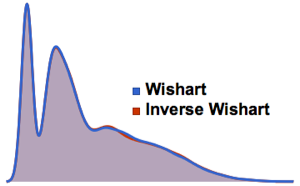
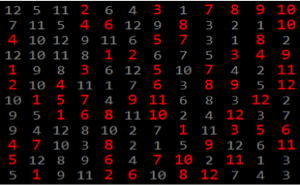
Sample from a Wishart distribution with identity scale matrix and compute the scaled eigenvalues.
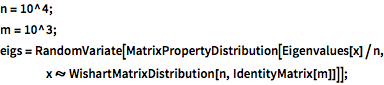
n = 10^4;
m = 10^3;
eigs = RandomVariate[
MatrixPropertyDistribution[Eigenvalues[x]/n,
x \[Distributed]
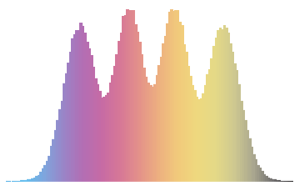
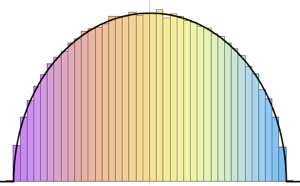
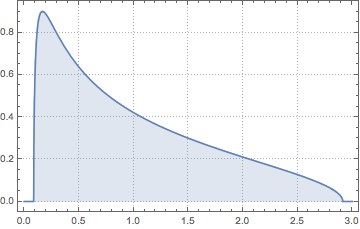
WishartMatrixDistribution[n, IdentityMatrix[m]]]];Compare the sampled result with the Marchenko–Pastur density function.
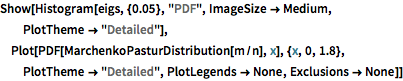
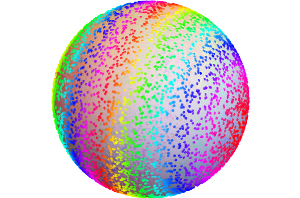
Show[Histogram[eigs, {0.05}, "PDF", ImageSize -> Medium,
  PlotTheme -> "Detailed"],
 Plot[PDF[MarchenkoPasturDistribution[m/n], x], {x, 0, 1.8},
  PlotTheme -> "Detailed", PlotLegends -> None, Exclusions -> None]]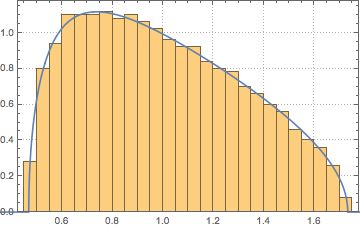
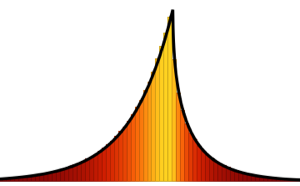
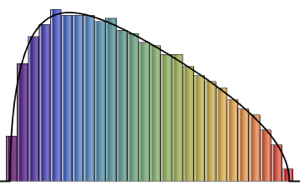
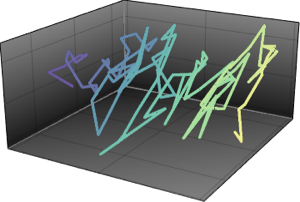
For  , the Wishart matrix is singular. With probability
  , the distribution has a point mass at
  .
.
m = 500; n = 2 m;
CDF[MarchenkoPasturDistribution[n/m], 0]Generate a singular Wishart matrix with identity covariance and compute the scaled eigenvalues.
matrix = Transpose[#].# &[RandomVariate[NormalDistribution[], {m, n}]];
eigvs = Chop[Eigenvalues[matrix]/m];
There is a gap in the density of eigenvalues near 0, and the bin at 0 has a large density.
Histogram[eigvs, {0.05}, PDF, PlotRange -> 1, ChartStyle -> Orange,
 ImageSize -> Medium]
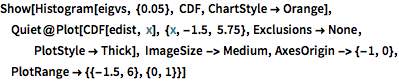
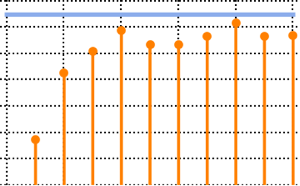
Fit MarchenkoPasturDistribution to the eigenvalues.
edist = EstimatedDistribution[eigvs,
MarchenkoPasturDistribution[\[Lambda], 1]]CDF of the fitted distribution shows a jump discontinuity at the origin.