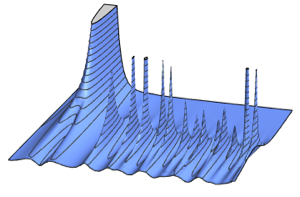
Spectral Density of a Matrix
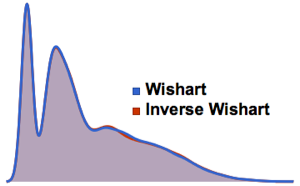
The joint spectral density of many matrix distributions has a corresponding universal limiting form. For Hermitian random matrices with independent entries, this is the Wigner semicircle law.
For Gaussian ensembles, the scaled spectral density of the matrices has a closed form for finite matrix dimension, related to the eigenfunctions of the quantum harmonic oscillator.
Use MatrixPropertyDistribution to represent the scaled spectrum of the Gaussian unitary ensemble and provide the closed-form expression of its joint spectral density.
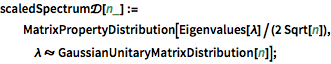
scaledSpectrum\[ScriptCapitalD][n_] :=
  MatrixPropertyDistribution[
   Eigenvalues[\[Lambda]]/(2 Sqrt[n]), \[Lambda] \[Distributed]
    GaussianUnitaryMatrixDistribution[n]];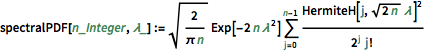
spectralPDF[n_Integer, \[Lambda]_] :=
Sqrt[2/(\[Pi] n)] Exp[-2 n \[Lambda]^2] \!\(
\*UnderoverscriptBox[\(\[Sum]\), \(j = 0\), \(n - 1\)]
\*FractionBox[
SuperscriptBox[\(HermiteH[j,
\*SqrtBox[\(2\ n\)]\ \[Lambda]]\), \(2\)], \(
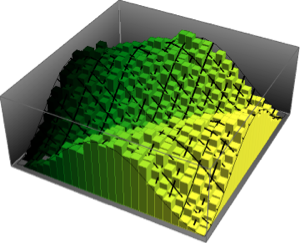
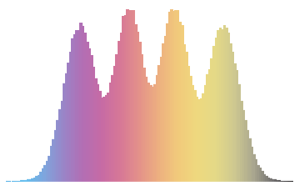
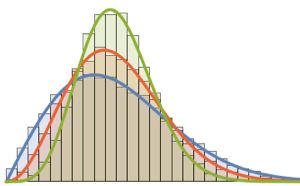
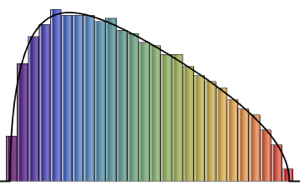
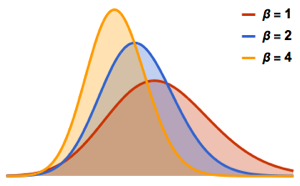
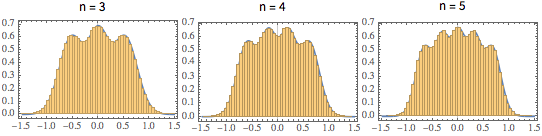
\*SuperscriptBox[\(2\), \(j\)]\ \(j!\)\)]\)For small matrix dimension, there is a characteristic oscillatory pattern, whose number of density maxima equals the matrix size.
scaledSpectra =
  Flatten[RandomVariate[scaledSpectrum\[ScriptCapitalD][#],
      10^5]] & /@ {3, 4, 5};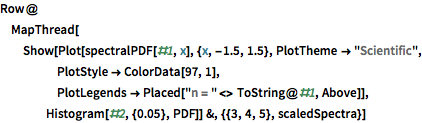
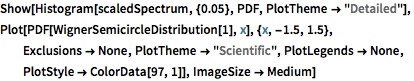
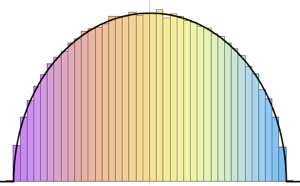
In the limit of large dimension, the density converges to WignerSemicircleDistribution.
n = 250;
scaledSpectrum =
  Flatten[RandomVariate[scaledSpectrum\[ScriptCapitalD][n], 10^2]];