Wishart and Inverse Wishart Distributions
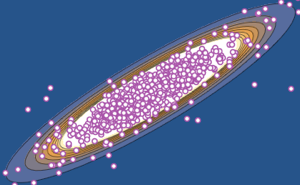
The Wishart distribution is the distribution of the covariance matrix of samples drawn from independent multinormal random vectors. It is a generalization of  distribution to multiple dimensions. The distribution appears naturally in multivariate statistics such as regression, covariance, etc.
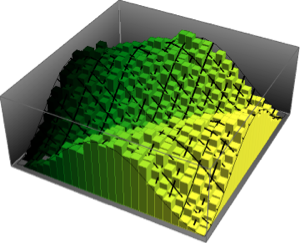
Generate a random positive definitive matrix to use as parameters for the Wishart distribution.
\[CapitalSigma] = DiagonalMatrix[RandomReal[10, 5]];Matrices from the Wishart distribution are symmetric and positive definite. »
dist = WishartMatrixDistribution[30, \[CapitalSigma]];
mat = RandomVariate[dist];SymmetricMatrixQ[mat] && PositiveDefiniteMatrixQ[mat]Inverse Wishart distribution is the distribution of the inverse matrices from the Wishart distribution. »
invdist =
  InverseWishartMatrixDistribution[30, Inverse[\[CapitalSigma]]];
invmat = RandomVariate[invdist];
Matrices from the inverse Wishart distribution are symmetric and positive definite.
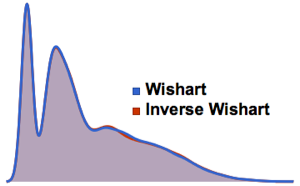
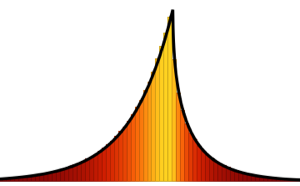
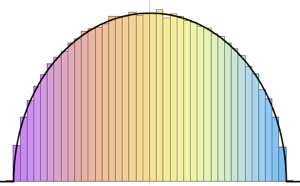
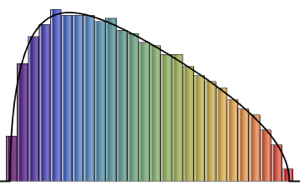
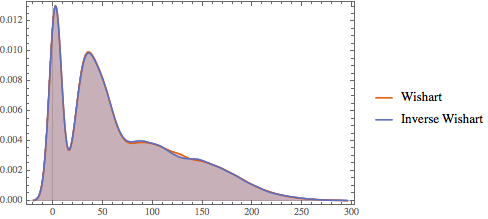
SymmetricMatrixQ[invmat] && PositiveDefiniteMatrixQ[invmat]Compare the distribution of eigenvalues for matrices from the Wishart and inverse Wishart distributions.
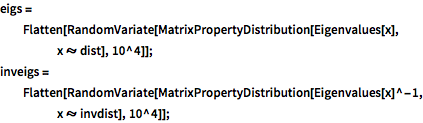
eigs = Flatten[
   RandomVariate[
    MatrixPropertyDistribution[Eigenvalues[x], x \[Distributed] dist],
     10^4]];
inveigs =
  Flatten[RandomVariate[
    MatrixPropertyDistribution[Eigenvalues[x]^-1,
     x \[Distributed] invdist], 10^4]];
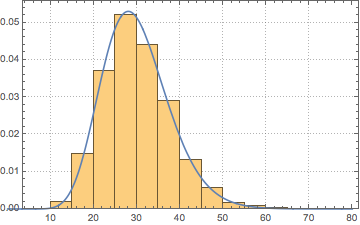
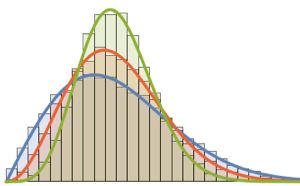
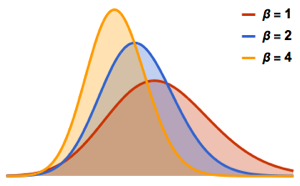
For any nonzero vector  and Wishart matrix
  with scale matrix
  , the statistic
  is
is  distributed.
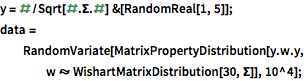
y = #/Sqrt[#.\[CapitalSigma].#] &[RandomReal[1, 5]];
data = RandomVariate[
   MatrixPropertyDistribution[y.w.y,
    w \[Distributed] WishartMatrixDistribution[30, \[CapitalSigma]]],
10^4];Show[Histogram[data, Automatic, PDF, PlotTheme -> "Detailed"],
Plot[PDF[ChiSquareDistribution[30], x], {x, 0, 80}],
ImageSize -> Medium]