Tracy–Widom Distribution
Tracy–Widom distribution is the limiting distribution of the scaled largest eigenvalue of a random matrix belonging to Gaussian ensembles. It also appears in various different disciplines, such as counting problems, random growth models, phase transitions, etc., and gives accurate predictions.
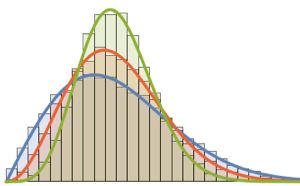
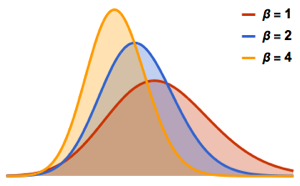
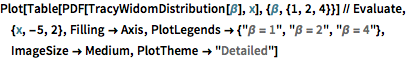
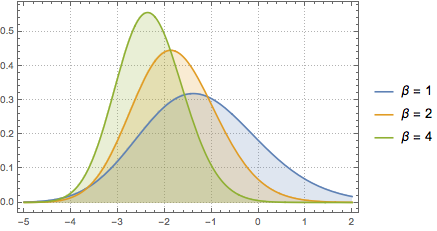
Tracy–Widom distribution consists of three classes  ,
,  , and
, and  . Each corresponds to different Gaussian ensembles; see the corresponding PDFs.
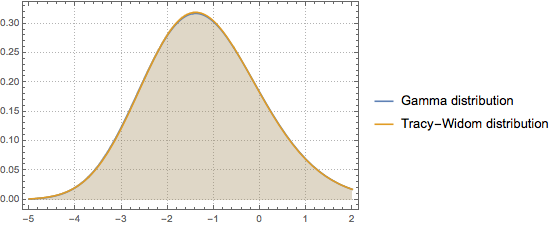
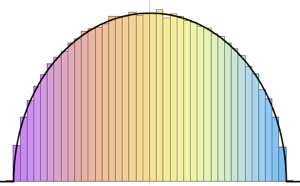
Use MatrixPropertyDistribution to represent the scaled largest eigenvalue of a matrix from GUE.
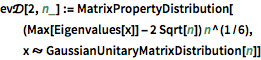
ev\[ScriptCapitalD][2, n_] :=
MatrixPropertyDistribution[(Max[Eigenvalues[x]] - 2 Sqrt[n]) n^(1/6),
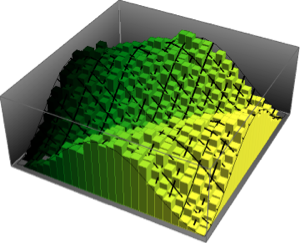
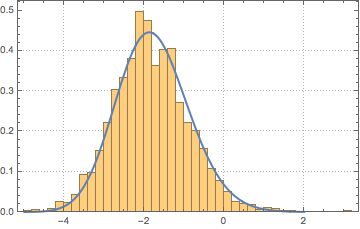
x \[Distributed] GaussianUnitaryMatrixDistribution[n]]Sample from the distribution and compare the histogram with the PDF.
sample = RandomVariate[ev\[ScriptCapitalD][2, 250], 2000];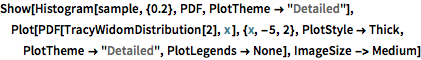
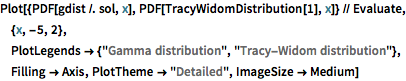
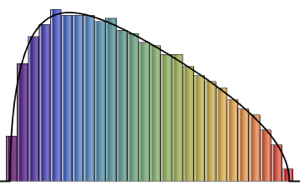
Tracy–Widom distribution can be well approximated by gamma distribution in the central region.
gdist = GammaDistribution[k, s, 1, a];
PDF[gdist, x]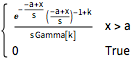
Fit gamma distribution with Tracy–Widom distribution of  by matching the first three moments.
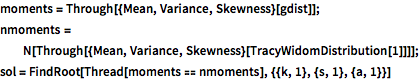
moments = Through[{Mean, Variance, Skewness}[gdist]];
nmoments =
  N[Through[{Mean, Variance, Skewness}[TracyWidomDistribution[1]]]];
sol = FindRoot[Thread[moments == nmoments], {{k, 1}, {s, 1}, {a, 1}}]Compare the PDFs.