行列分布の特性
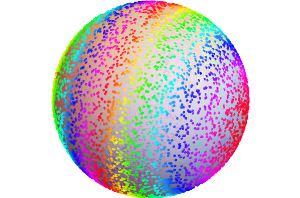
ランダム行列から導かれた低次元統計は,行列アンサンブルを特徴付ける際に大きな役割を果たす.いろいろな極限状況において,これらの統計の分布はさまざまな普遍性クラスに分解される.MatrixPropertyDistributionは導き出されたこれらの求められた特性の数値近似をサンプリングし,計算するのに便利である.
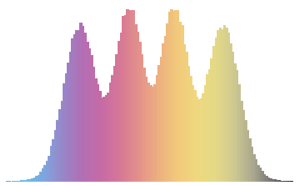
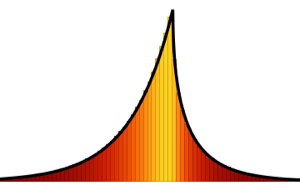
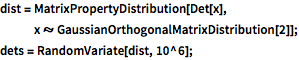
ガウス型ユニタリアンサンブルから最も大きい2つの固有値をサンプリングする.
In[1]:=
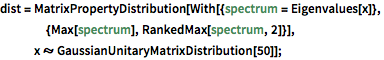
dist = MatrixPropertyDistribution[With[{spectrum = Eigenvalues[x]},
    {Max[spectrum], RankedMax[spectrum, 2]}],
   x \[Distributed] GaussianUnitaryMatrixDistribution[50]];
In[2]:=
RandomVariate[dist]Out[2]=
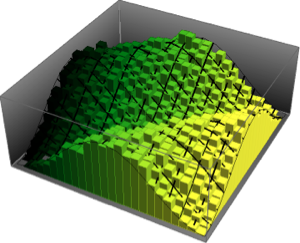
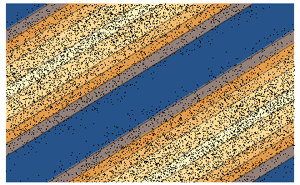
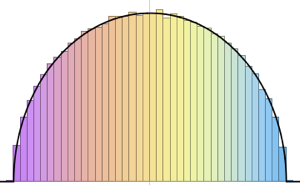
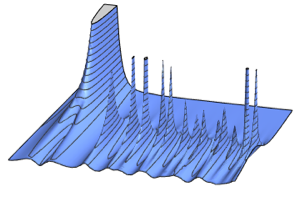
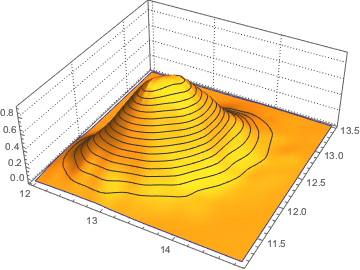
最も大きい2つの固有値の結合分布を,サンプリングの結果に基いて可視化する.
In[3]:=
sample = RandomVariate[dist, 10^4];完全なWolfram言語入力を表示する
Out[4]=
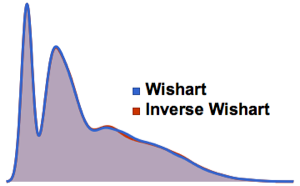
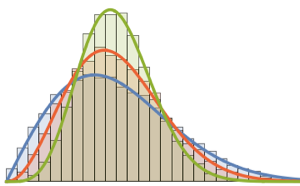
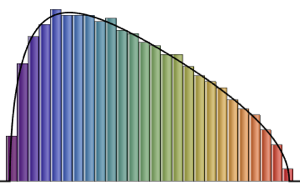
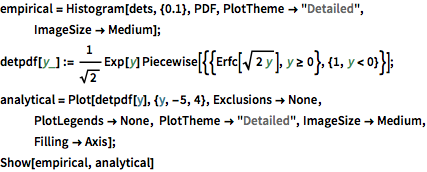
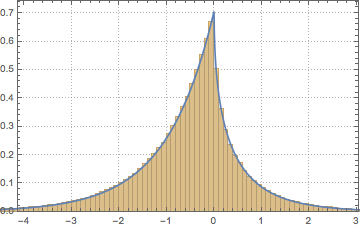
ガウス型直交アンサンブルの行列式をサンプリングし,経験分布と閉形式の式を比較する.
In[5]:=
dist = MatrixPropertyDistribution[Det[x],
   x \[Distributed] GaussianOrthogonalMatrixDistribution[2]];
dets = RandomVariate[dist, 10^6];
完全なWolfram言語入力を表示する
Out[6]=
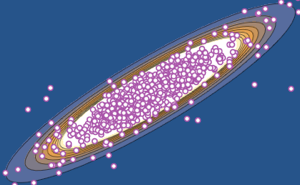
行列式の平均をモンテカルロサンプリングで近似し,実際の値と比較する.
In[7]:=
{N@Mean[dist], Integrate[x detpdf[x], {x, -Infinity, Infinity}]}Out[7]=