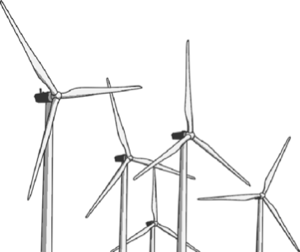
Wolfram Language

Medidas em probabilidade e estatística

Túneis

TunnelData fornece informações sobre túneis, tais como o seu comprimento e a localização.

In[1]:=
Click for copyable input
tunnels = TunnelData[];
In[2]:=
Click for copyable input
Length[tunnels]
Out[2]=

Para cada túnel, ache o seu comprimento e localização dada por país ou países.

In[3]:=
Click for copyable input
rawData = TunnelData[tunnels, {"Countries", "Length"}];

Limpe os dados para remover os valores que faltam.

In[4]:=
Click for copyable input
data = DeleteMissing[rawData, 1, 2];

Converta os dados de comprimento para milhas.

In[5]:=
Click for copyable input
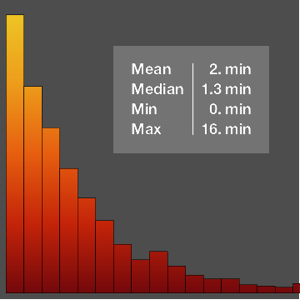
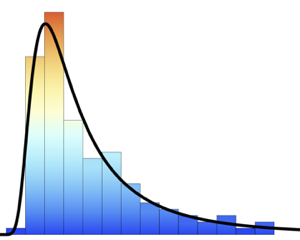
data[[All, 2]] = UnitConvert[N[data[[All, 2]]], "Miles"];
In[6]:=
Click for copyable input
lengths = data[[All, 2]];
In[7]:=
Click for copyable input
MinMax[lengths]
Out[7]=
In[8]:=
Click for copyable input
h = Histogram[lengths, {1, 12, .5}, PDF, FrameLabel -> Automatic, PlotTheme -> "Detailed"]
Out[8]=

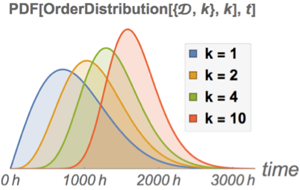
Os dados podem ser descritos por uma mistura de distribuições de cauda longa.

In[9]:=
Click for copyable input
dist = MixtureDistribution[{w1, w2}, {ParetoDistribution[a1, a2, a3, a4], WeibullDistribution[b1, b2]}];
In[10]:=
Click for copyable input
edist = EstimatedDistribution[lengths, dist]
Out[10]=

Teste a bondade de ajuste com relação as distribuições de mistura da família paramétrica.

In[11]:=
Click for copyable input
DistributionFitTest[lengths, dist, "TestDataTable"]
Out[11]=

Faça o gráfico da PDF da distribuição ajustada com relação ao histograma.

In[12]:=
Click for copyable input
Show[h, Plot[PDF[edist, Quantity[x, "Miles"]], {x, 1, 12}, PlotRange -> All] // Quiet]
Out[12]=

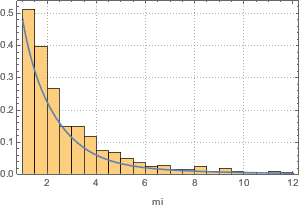
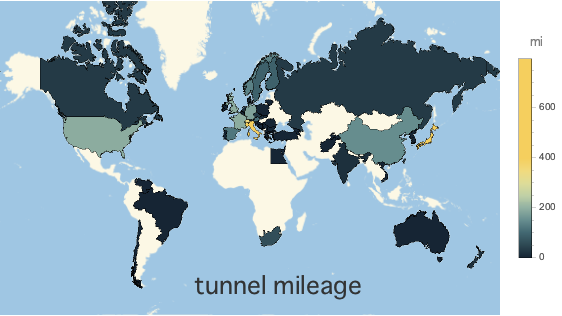
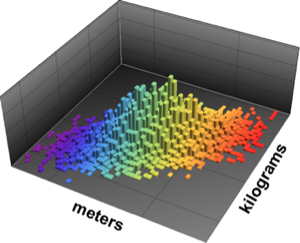
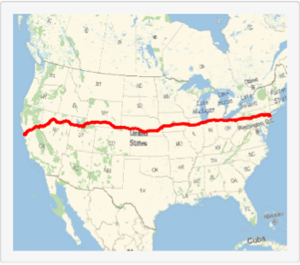
Visualize as localizações dos túneis.

Agrupe por país.

In[13]:=
Click for copyable input
res = GroupBy[data, First, Flatten[Take[#, All, -1]] &];

Alguns túneis estão localizados em mais de um país.

In[14]:=
Click for copyable input
shared = Select[Keys[res], Length[#] > 1 &]
Out[14]=

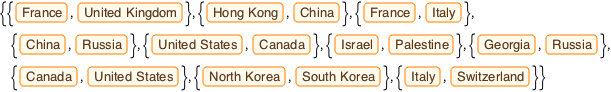
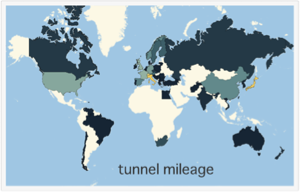
Distribua os túneis compartilhados e selecione os países que têm pelo menos 10 túneis. Faça o gráfico de distribuição de comprimento.

mostre o input completo da Wolfram Language
In[15]:=
Click for copyable input
split = GroupBy[ Flatten[Map[{{{#[[1]]}, res[#]}, {{#[[2]]}, res[#]}} &, shared], 1], First, Flatten[#[[All, 2]]] &];
In[16]:=
Click for copyable input
together = Join[KeyDrop[res, shared], split, 2];
In[17]:=
Click for copyable input
tc = SortBy[Select[Normal[together], Length[#[[2]]] >= 10 &], Length@*Last];
In[18]:=
Click for copyable input
DistributionChart[tc[[All, 2]], ChartLabels -> tc[[All, 1, 1]], BarOrigin -> Left, BarSpacing -> .3, FrameLabel -> {"Miles"}, LabelingFunction -> (Placed[Length[#1], After] &), ChartStyle -> "SandyTerrain", ImageSize -> Large]
Out[18]=

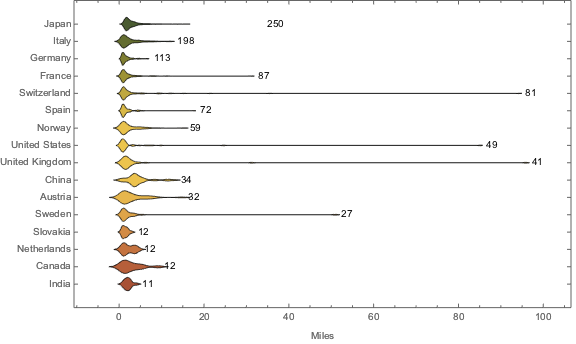
A quilometragem total dos túneis por país com túneis compartilhados incluídos no comprimento total para cada país.

mostre o input completo da Wolfram Language
In[19]:=
Click for copyable input
vals = KeyMap[First, Map[Total, together]]; title = Style["tunnel mileage", 24, Bold, GrayLevel[.2], FontFamily -> "Osaka"]; GeoRegionValuePlot[vals, GeoProjection -> "Mercator", GeoRange -> {{-65, 80}, {-170, 190}}, PlotLegends -> Automatic, ColorFunction -> (ColorData["StarryNightColors", 2 #] &), Epilog -> Inset[title, {30, -65}], ImageSize -> 500]
Out[19]=

Exemplos Relacionados

de en es fr ja ko ru zh